
Understanding Reaction Time: A Deep Dive
Sports performance is a complex interplay of physical and cognitive abilities. Among these, reaction time has conventionally been held as a pivotal metric. However, is it sufficient to gauge an athlete's overall cognitive capability solely based on their reaction time?

Sports performance is a complex interplay of physical and cognitive abilities. Among these, reaction time has conventionally been held as a pivotal metric. However, is it sufficient to gauge an athlete's overall cognitive capability solely based on their reaction time? This blog post will guide you, whether you are an athlete, coach, or sports enthusiast, through the multifaceted world of reaction time, elucidating its relationship with other equally vital metrics. Our goal is to provide a comprehensive understanding that transcends the conventional and delves into the depths of performance analytics.
Unraveling Reaction Time
In the intricate dance of sports, reaction time is akin to the first step: crucial, telling, yet only the beginning. It's a metric that quantifies the moments, often mere milliseconds, between a stimulus and the start of a response. If you've ever marveled at a sprinter's lightning-fast start at the sound of the gun or watched in awe as a tennis player expertly returns a blistering serve, you've witnessed the magic of optimized reaction time in action.
However, as with many things in life, averages can be deceiving. Imagine two athletes, both boasting an average reaction time of around 150ms. On paper, they seem identical in this aspect, but is that truly the case?
To better understand this, let's dive into some data.
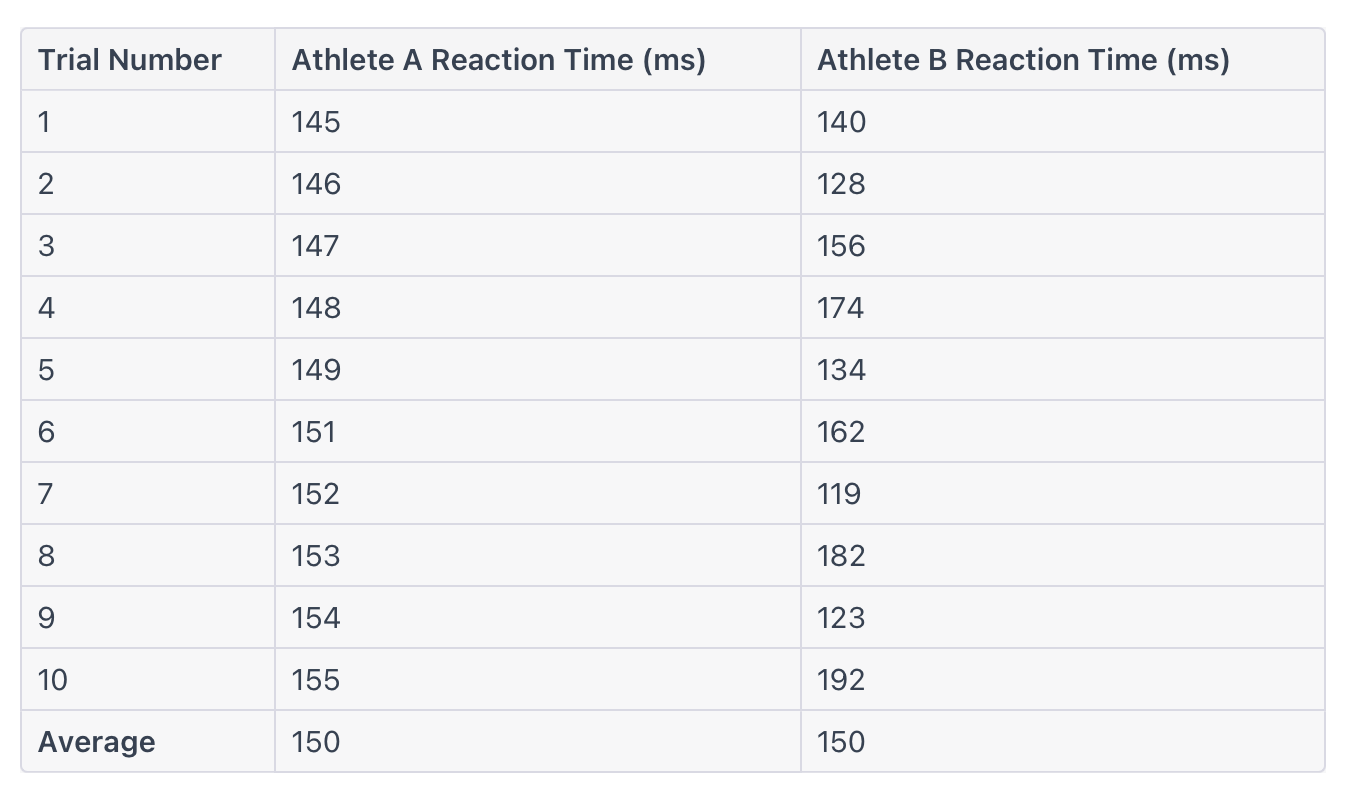
Upon close observation, while both athletes have the exact same average reaction time, the way they achieve this average differs significantly. Athlete A's reaction times are closely bunched, showing a high degree of consistency. In contrast, Athlete B's times dance up and down, showing a broader range and more variability.
This variation underscores a pivotal point: averages, while useful, can mask underlying intricacies. Two athletes might share an identical average reaction time, but the story of their performance, the highs, lows, and the in-betweens, can be vastly different.
The Deception of Averages
Every athlete and coach understands the importance of metrics in evaluating and enhancing performance. Often, the first metric we encounter, be it in sports, education, or any performance-based activity, is the average. Averages, by their nature, are intended to provide a centralized, typical value from a set of data points. They're easily digestible and seemingly straightforward. However, they can sometimes be misleading, especially when used in isolation.
Imagine a trainer analyzing the performance of two athletes solely based on their average reaction times. If both athletes have an average reaction time of 150ms, the initial evaluation might conclude that both athletes have similar response capabilities. But as we've seen, this can be a misleading and overly simplistic interpretation.
While Athlete A's reactions hover consistently around the 150ms mark, Athlete B's reaction times swing widely from one extreme to the other. When we tunnel vision on averages, we might overlook these nuances. Such an oversight can lead to misguided training regimens or misjudged game strategies. The graph above visually captures the variance in performance across trials, underscoring the point that averages alone don't tell the full story.
A Deeper Perspective: The disparity between the two athletes becomes even more pronounced when we consider other metrics like speed and variation. Relying solely on average reaction time might suggest that the two athletes are on par. But as we'll explore in the subsequent sections, integrating additional metrics can paint a more complete picture, revealing hidden strengths or areas needing improvement.
Speed: Revealing the True Picture Beyond Average Reaction Times
In the domain of sports analytics, while reaction time provides a first-glance insight into an athlete's reflexive response, it might not paint the complete picture. Enter Speed — a metric that offers a more granulated and precise evaluation of performance.
Why Speed?
Speed is the reciprocal of reaction time. Instead of purely relying on the duration it takes for an athlete to respond, speed factors in the consistency and the variation present in those responses. It's a statistical measure that helps normalize the data distribution, making it less susceptible to extreme values or outliers.
The Concept of Data Normalization
But why is normalization so crucial? Consider this: humans aren't machines. Our performances inherently come with variations. A single extremely slow or fast response can skew the entire data set. Without normalization, these outliers can give a distorted picture of an athlete's performance. Speed, by virtue of its calculation, inherently addresses this issue by giving equal weightage to each individual performance, rather than an aggregate.
The Tale of Two Athletes
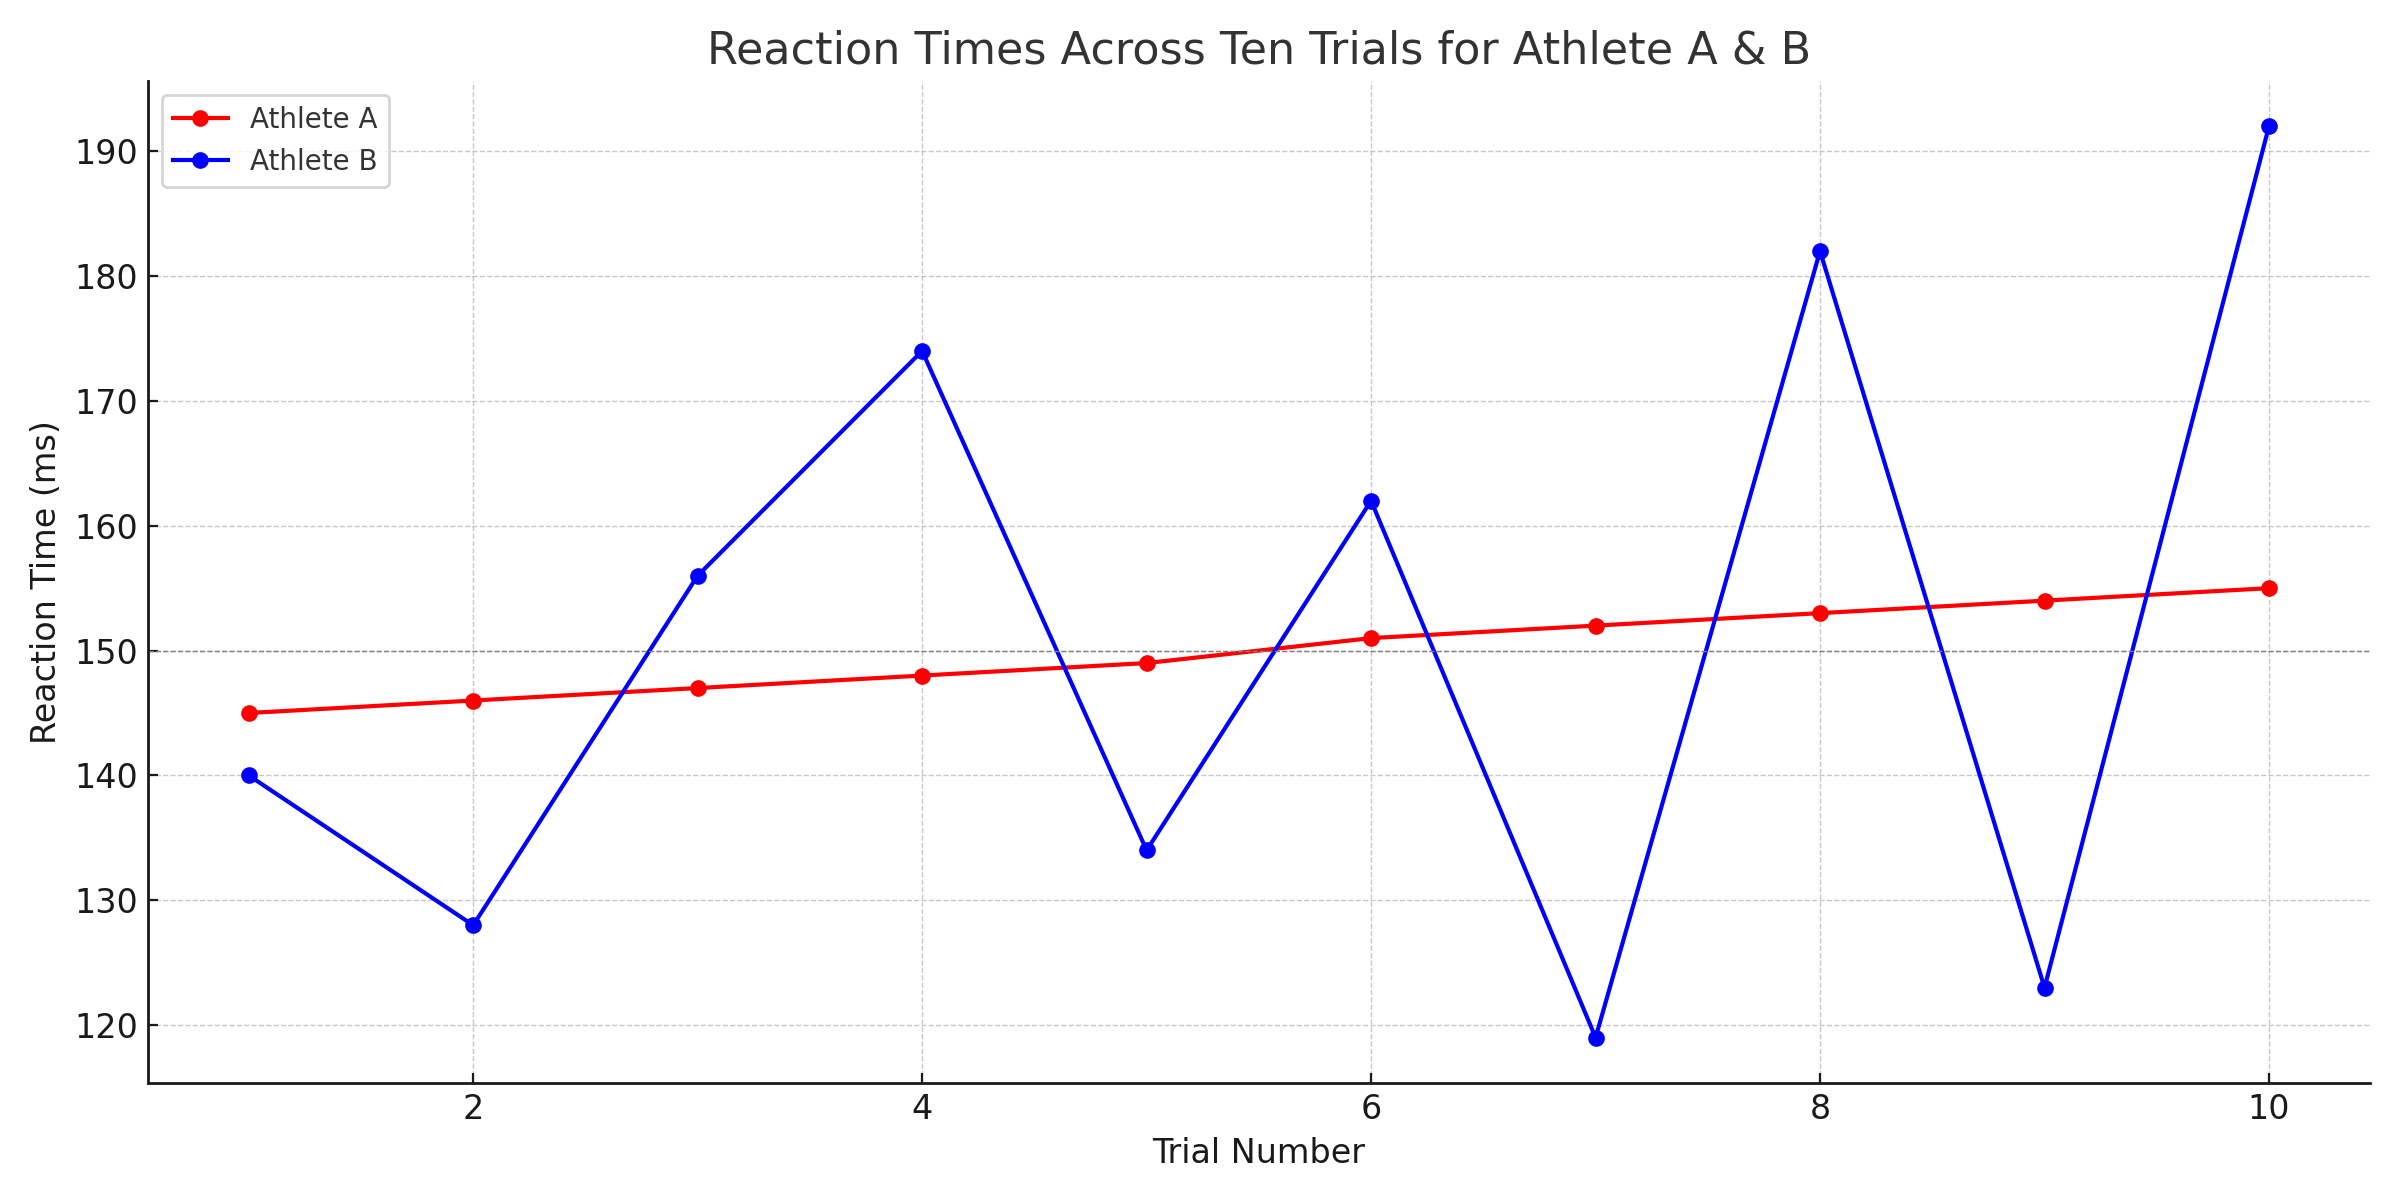
For a clearer picture, let's consider two athletes: Athlete C and Athlete D. Both underwent a series of tests, with each participating in 100 reaction time trials. Interestingly, both ended up with an identical average reaction time of 450ms. But does that mean their performances were truly the same? Let's dig deeper.
When analyzing the raw reaction times, the graph makes it evident that while both athletes may have the same average, Athlete D has more variability in their performance, with notable outliers.
Breaking Down the Numbers
Reaction Time Comparison:
- Athlete C's Average Reaction Time: 450ms
- Athlete D's Average Reaction Time: 450ms
- % Difference in Reaction Time: 0% (since they have identical reaction times)
Speed Comparison:
- Athlete C's Average Speed: 2.22
- Athlete D's Average Speed: 2.13
- % Difference in Speed: 4.05%
Despite having identical reaction times, there's a 4.05% difference in speed between Athlete C and Athlete D. This deviation underscores the importance of the speed metric. It captures the nuances in performance that a simple average of reaction times might overlook. In conclusion, while reaction time is a valuable measure, it's imperative to consider speed as it provides a more holistic view of an athlete's cognitive performance. Speed, by normalizing the data, offers insights that might be missed when solely relying on reaction times. It's a metric that truly reveals the nuances in performance, making it indispensable for coaches and athletes aiming for peak performance.
Variation: The Holy Grail in Cognitive Analysis
In the vast landscape of athletic performance metrics, while reaction time and speed frequently take center stage, there’s a pivotal metric that often goes unnoticed: Variation. For athletes and coaches aiming to grasp the full picture of performance, understanding variation is not just beneficial—it's crucial.
Unraveling the Essence of Variation
Variation quantifies the consistency of an athlete's performance across multiple trials. It's the range of an athlete’s responses around their average performance. Even if two athletes boast the same average reaction time, variation brings out the contrast in their performances, highlighting who remains consistent and who's more erratic.
In simpler terms: while averages give you a snapshot, variation provides the entire storyline. And in sports, consistency is often the real game-changer.
The Imperative Role of Variation
True improvement in sports isn't just about being faster or more agile; it's about consistently delivering top-notch performances. And that's where variation comes in. It doesn’t just indicate how well an athlete is performing—it reveals how consistently they're achieving those results.
Imagine a soccer player who can strike perfectly once but misses the next four shots unpredictably. Compare that with another player who consistently delivers near-perfect shots. While their average might appear similar, their variation tells a different tale.
A Comparative Tale: Athlete A vs. Athlete B Over Three Months
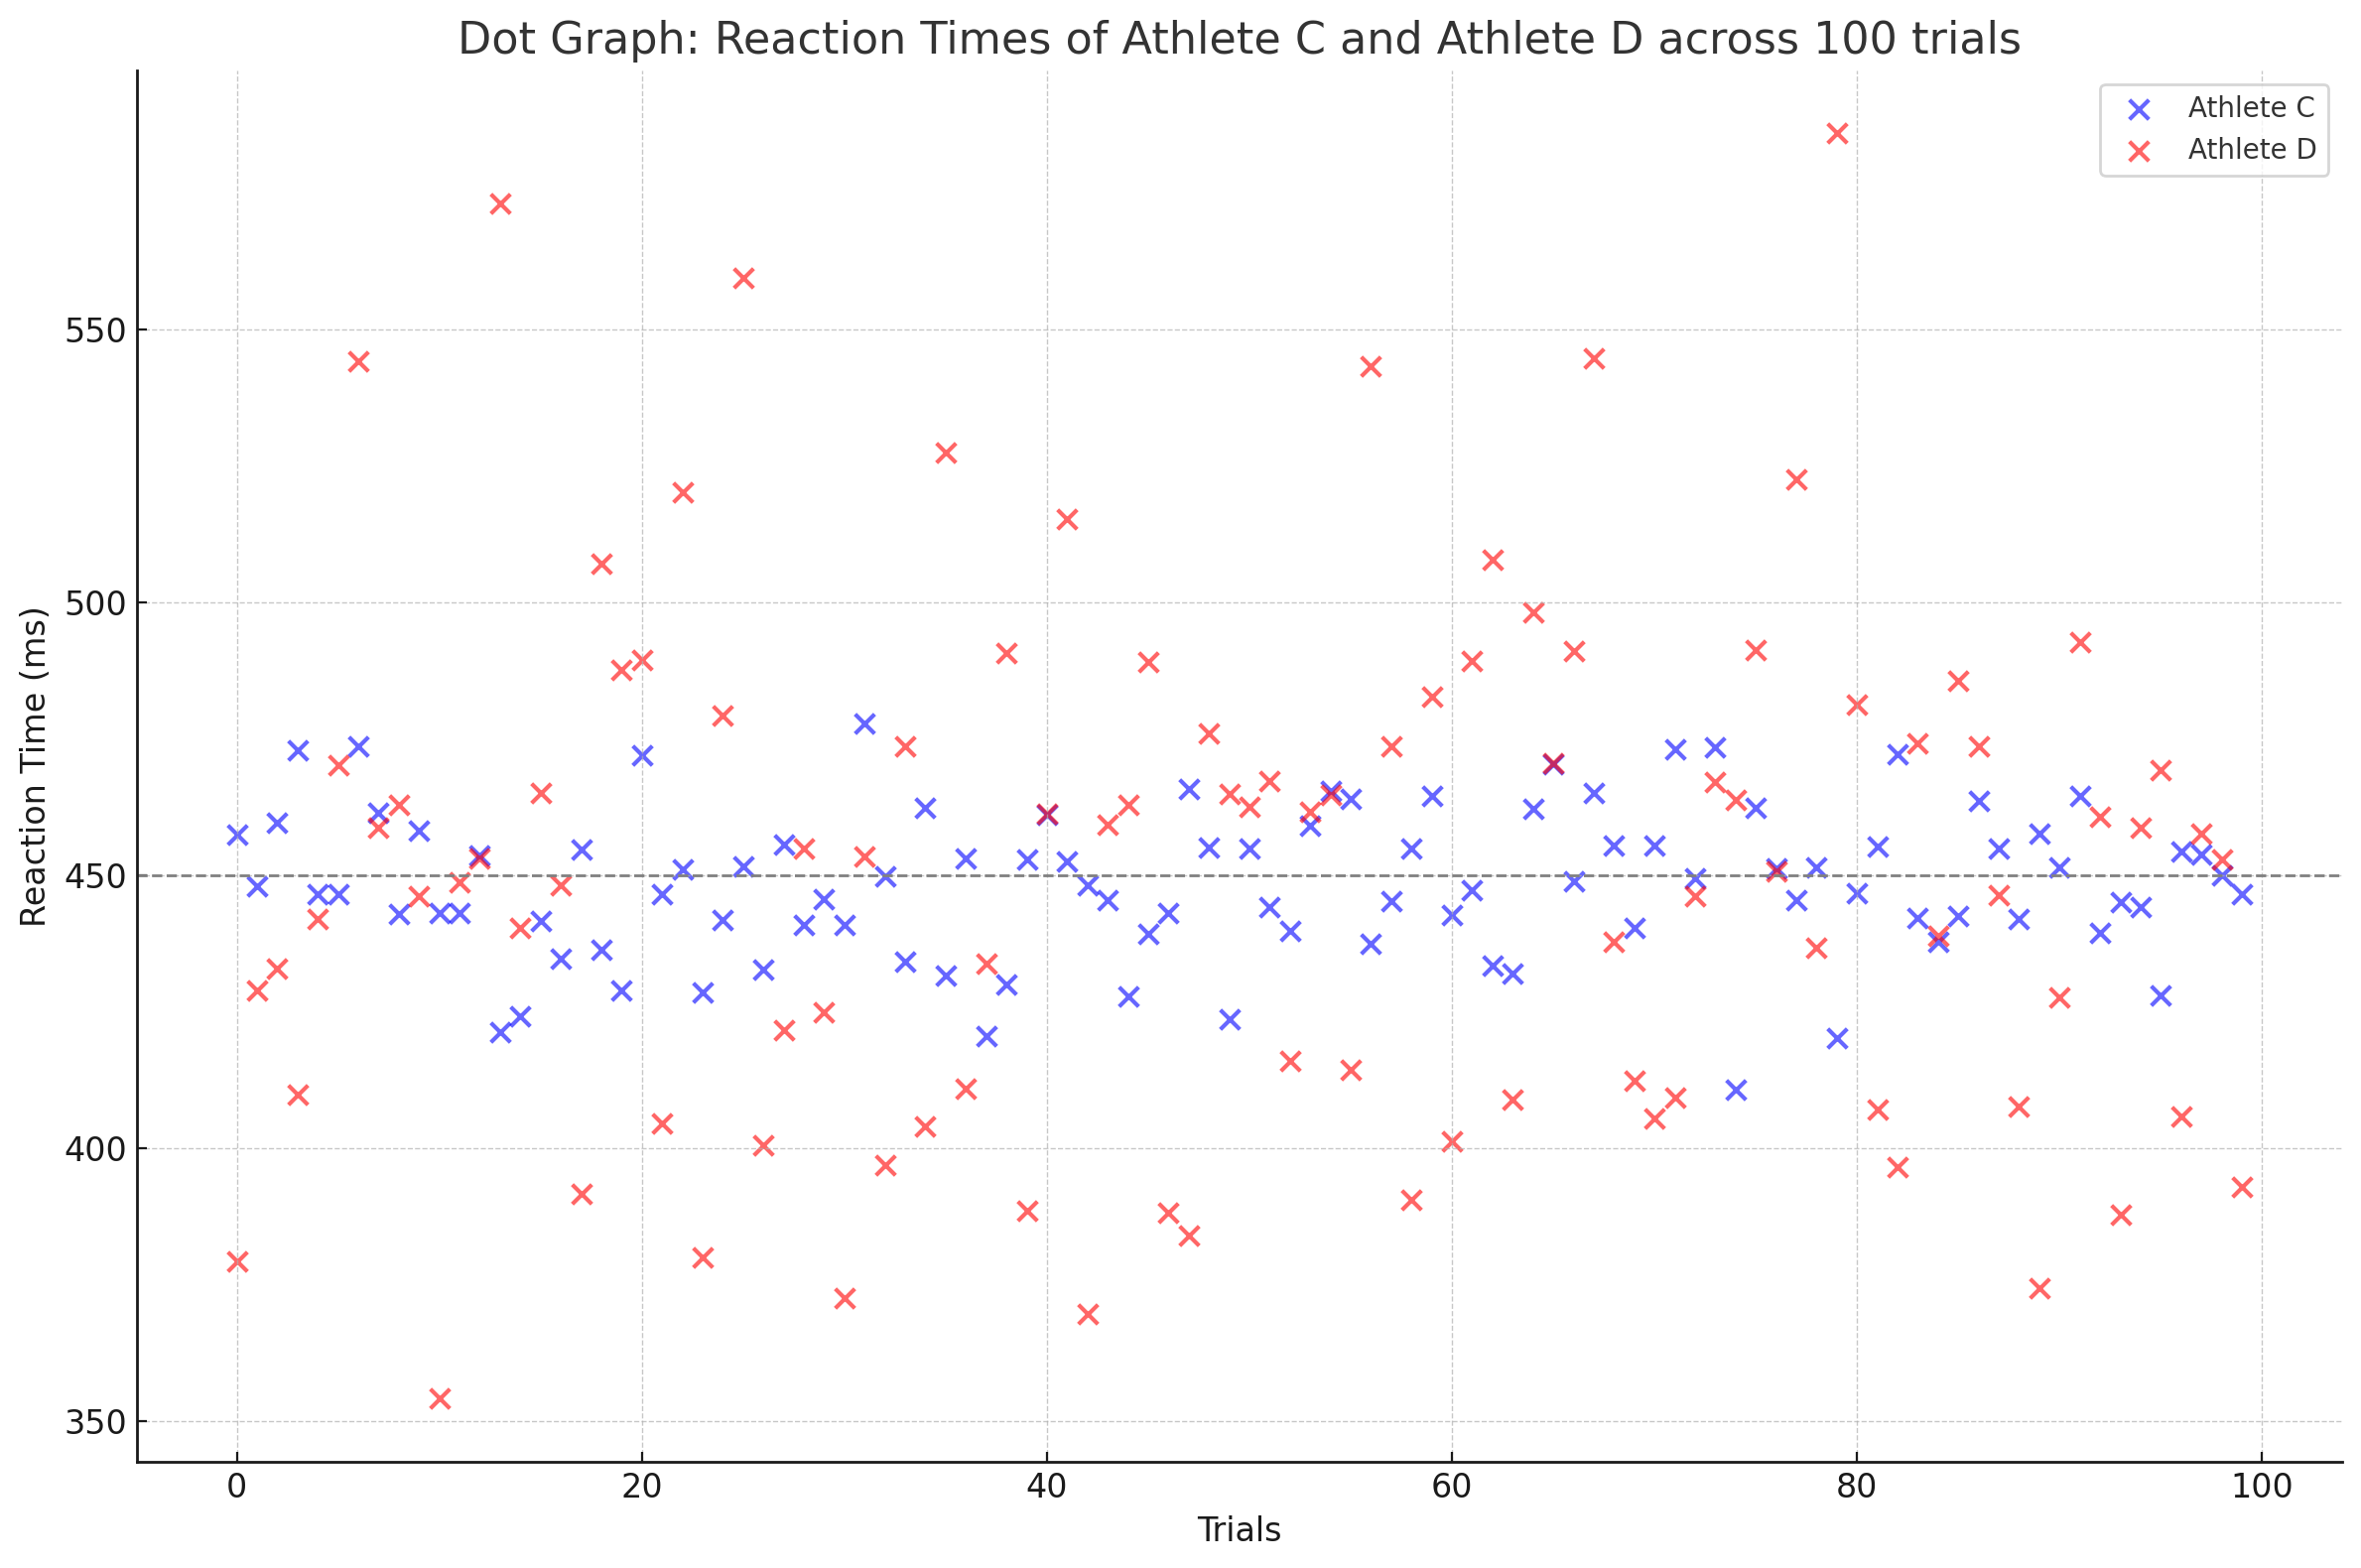
To truly understand the power of variation, let's delve into a three-month training plan of two athletes: Athlete E and Athlete F.
From this graph, at first glance, both athletes seem to have improved their reaction times. But let's delve deeper.
Over the training period, Athlete E improved their reaction time. However, their variation increased, indicating that while they got faster, their performance became more unpredictable. In contrast, Athlete F not only honed their reaction time but also demonstrated reduced variation—signifying a journey towards consistent brilliance.
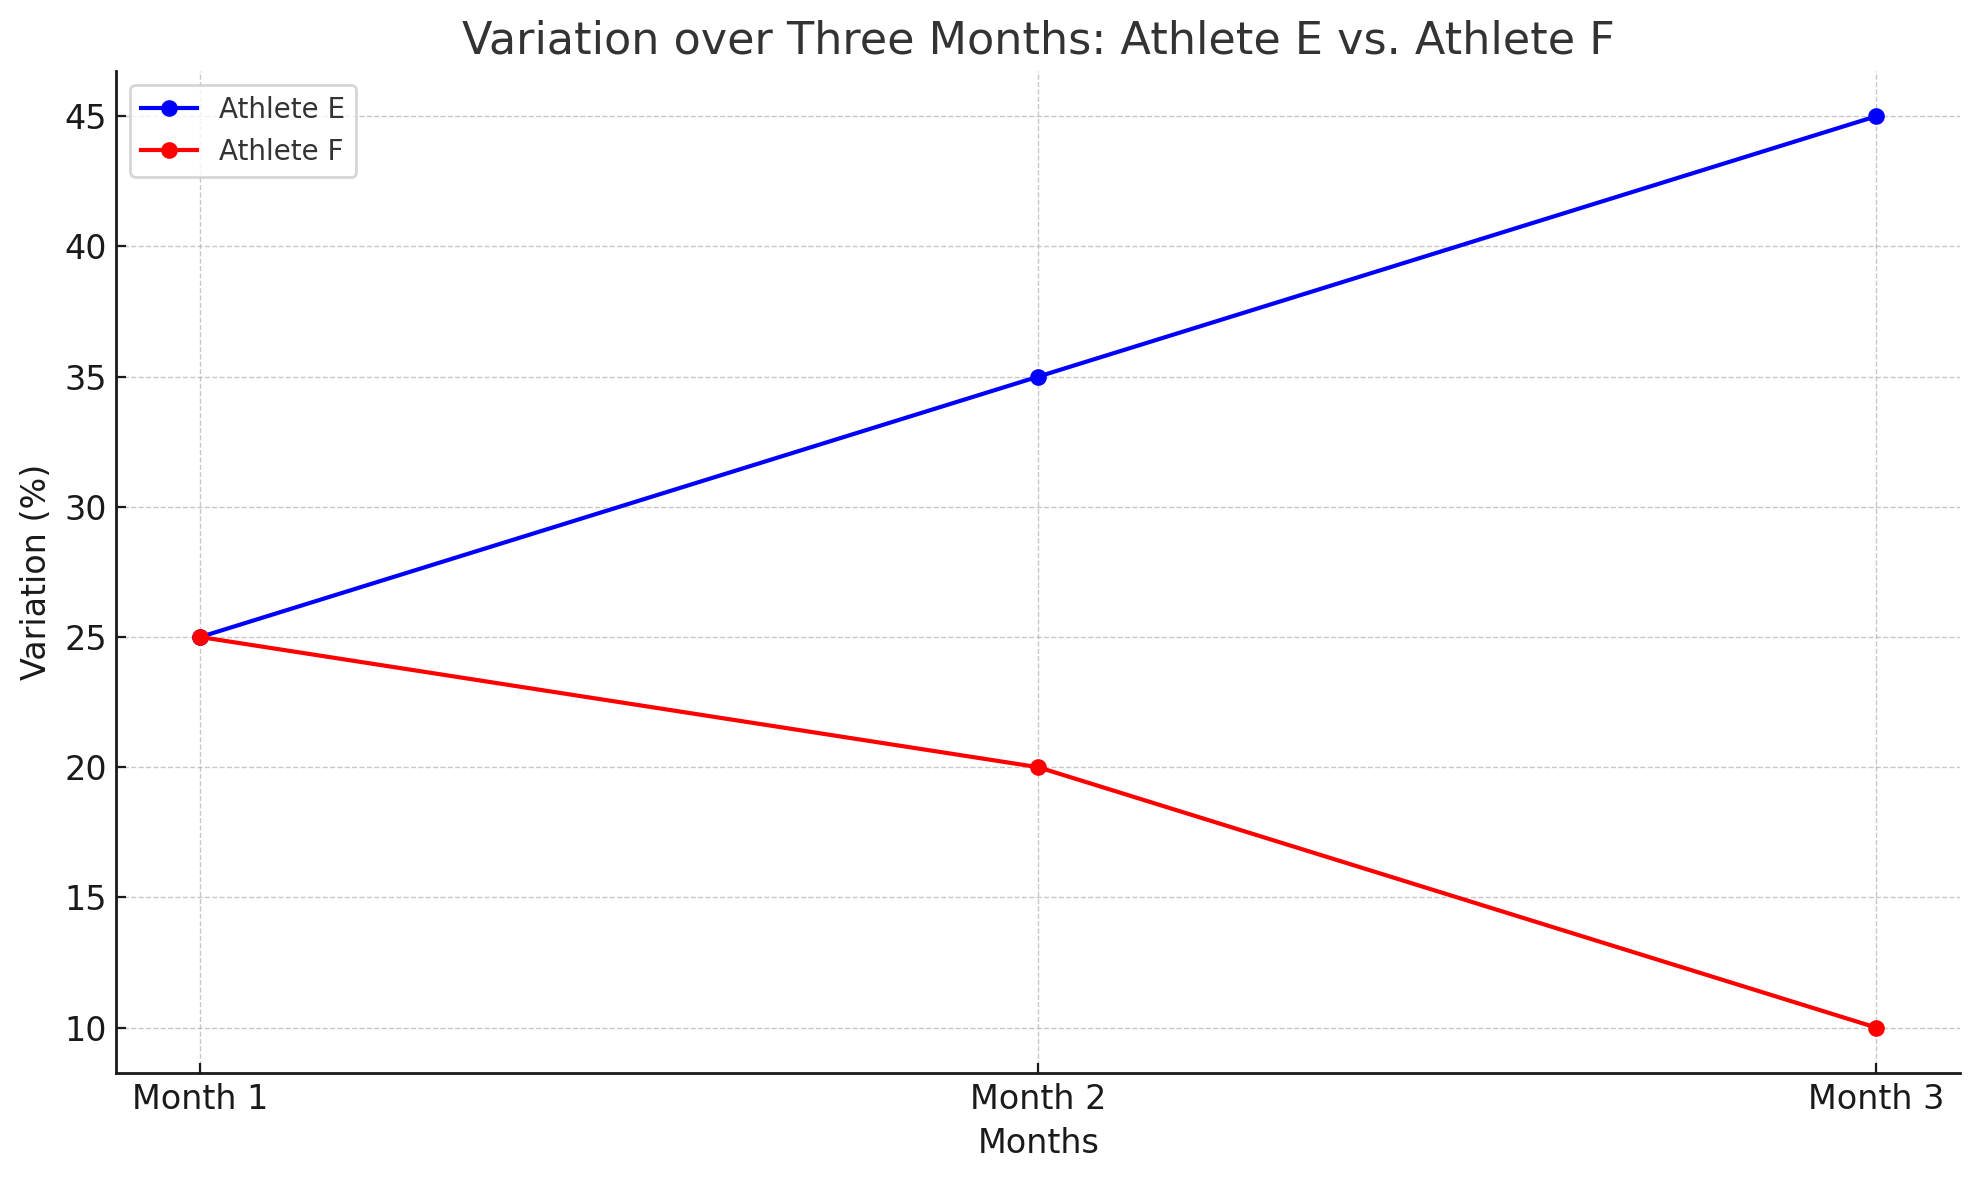
In a real-world scenario, while Athlete E has moments of unmatched performance, their inconsistency can be a liability. Athlete F, with consistent performance, becomes the more dependable choice.
Variation: The Key to Authentic Improvement
Without variation, we're essentially gauging athletic performance with one eye closed. Improving reaction time or speed is commendable, but if it's coupled with increased variation, it might be a sign of inconsistency.
For instance, an athlete might reduce their repeated sprint time. But if their variation increases, it suggests that while they might occasionally sprint faster, they're also more prone to off days where their performance drops. Conversely, an athlete who reduces their repeated sprint time and decreases their variation is not just sprinting faster—they're doing it more consistently.
In Conclusion, Variation is the unsung hero in cognitive analysis. While metrics like speed and reaction time provide valuable insights, it's variation that binds these insights into a comprehensive, actionable narrative. In the quest for peak performance, understanding and leveraging variation is the ace up an athlete's sleeve.
The Holy Grail: Reaction Time, Accuracy, Speed, and Variation
In the world of sports performance, metrics like reaction time and accuracy often come to the forefront. They provide a preliminary glimpse into an athlete's cognitive performance. But what happens when we dig deeper? How do we decipher the intricate stories behind these numbers? That's where speed and variation come into play. Let's dive deep into the data with two athletes, Athlete A and Athlete B, over a span of three months.
Traditional View: Reaction Time and Accuracy
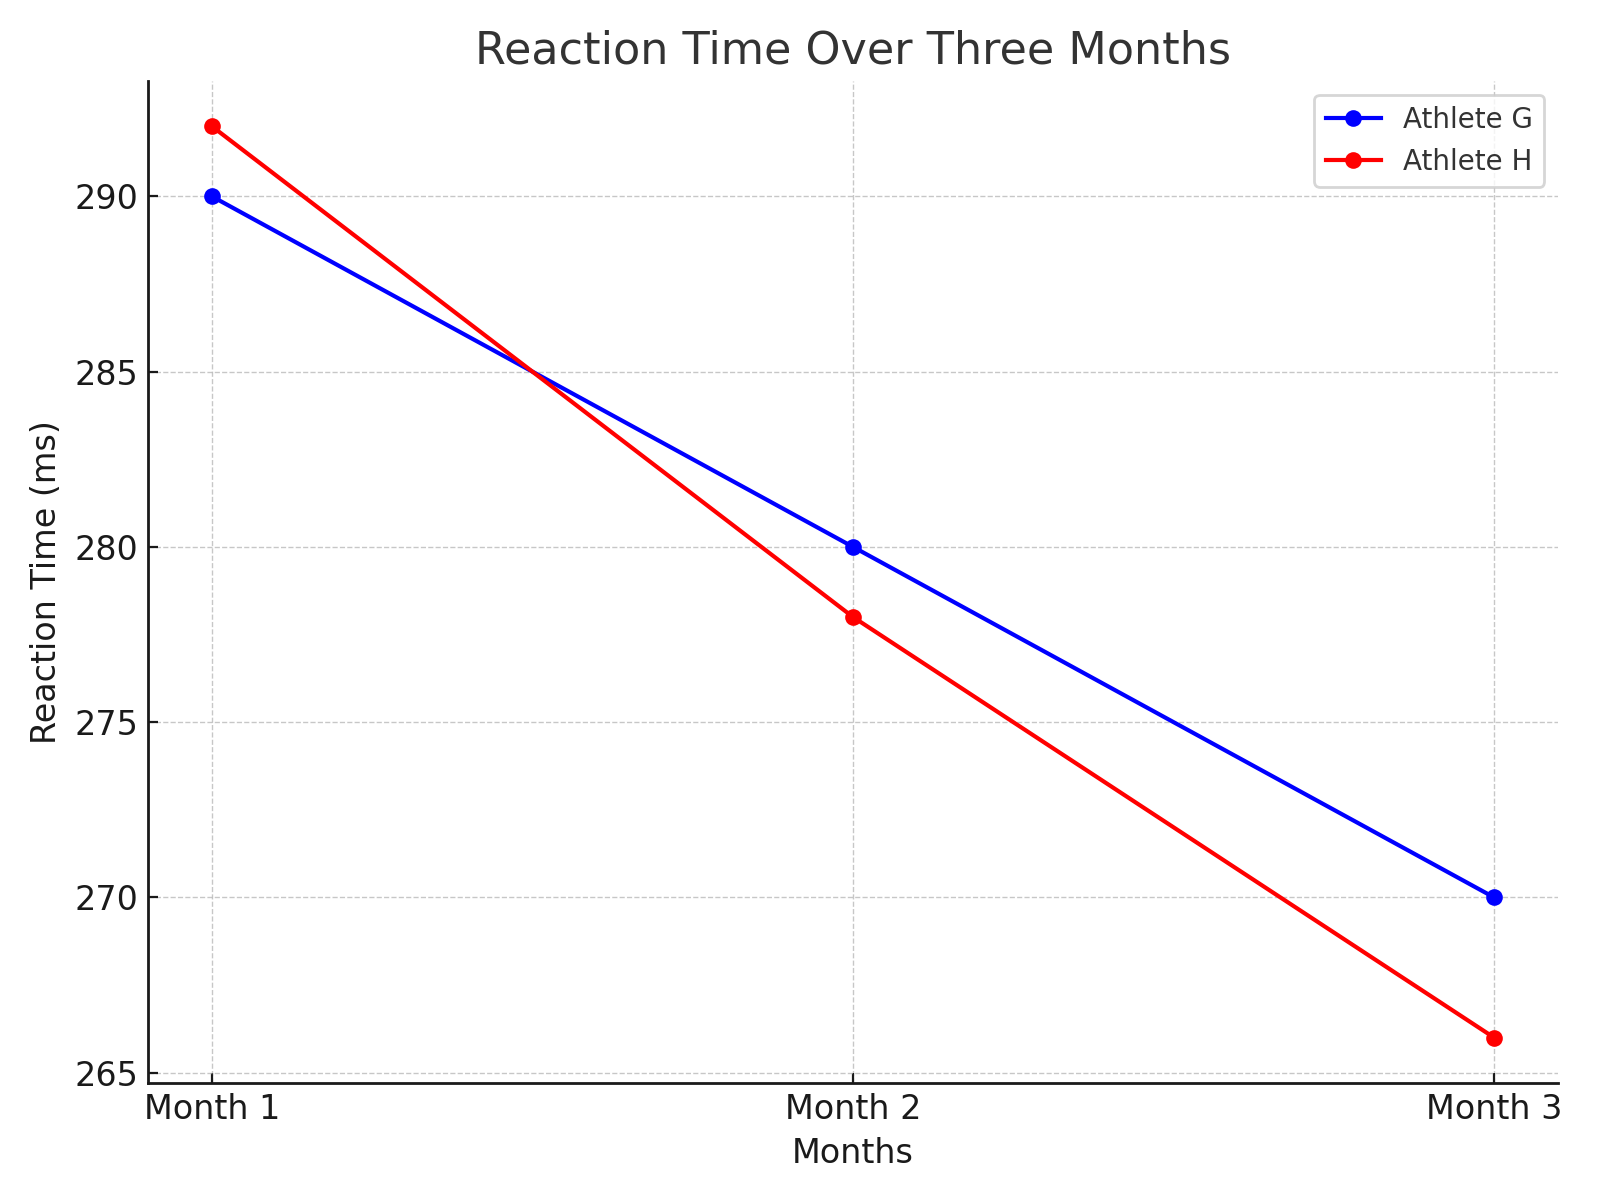
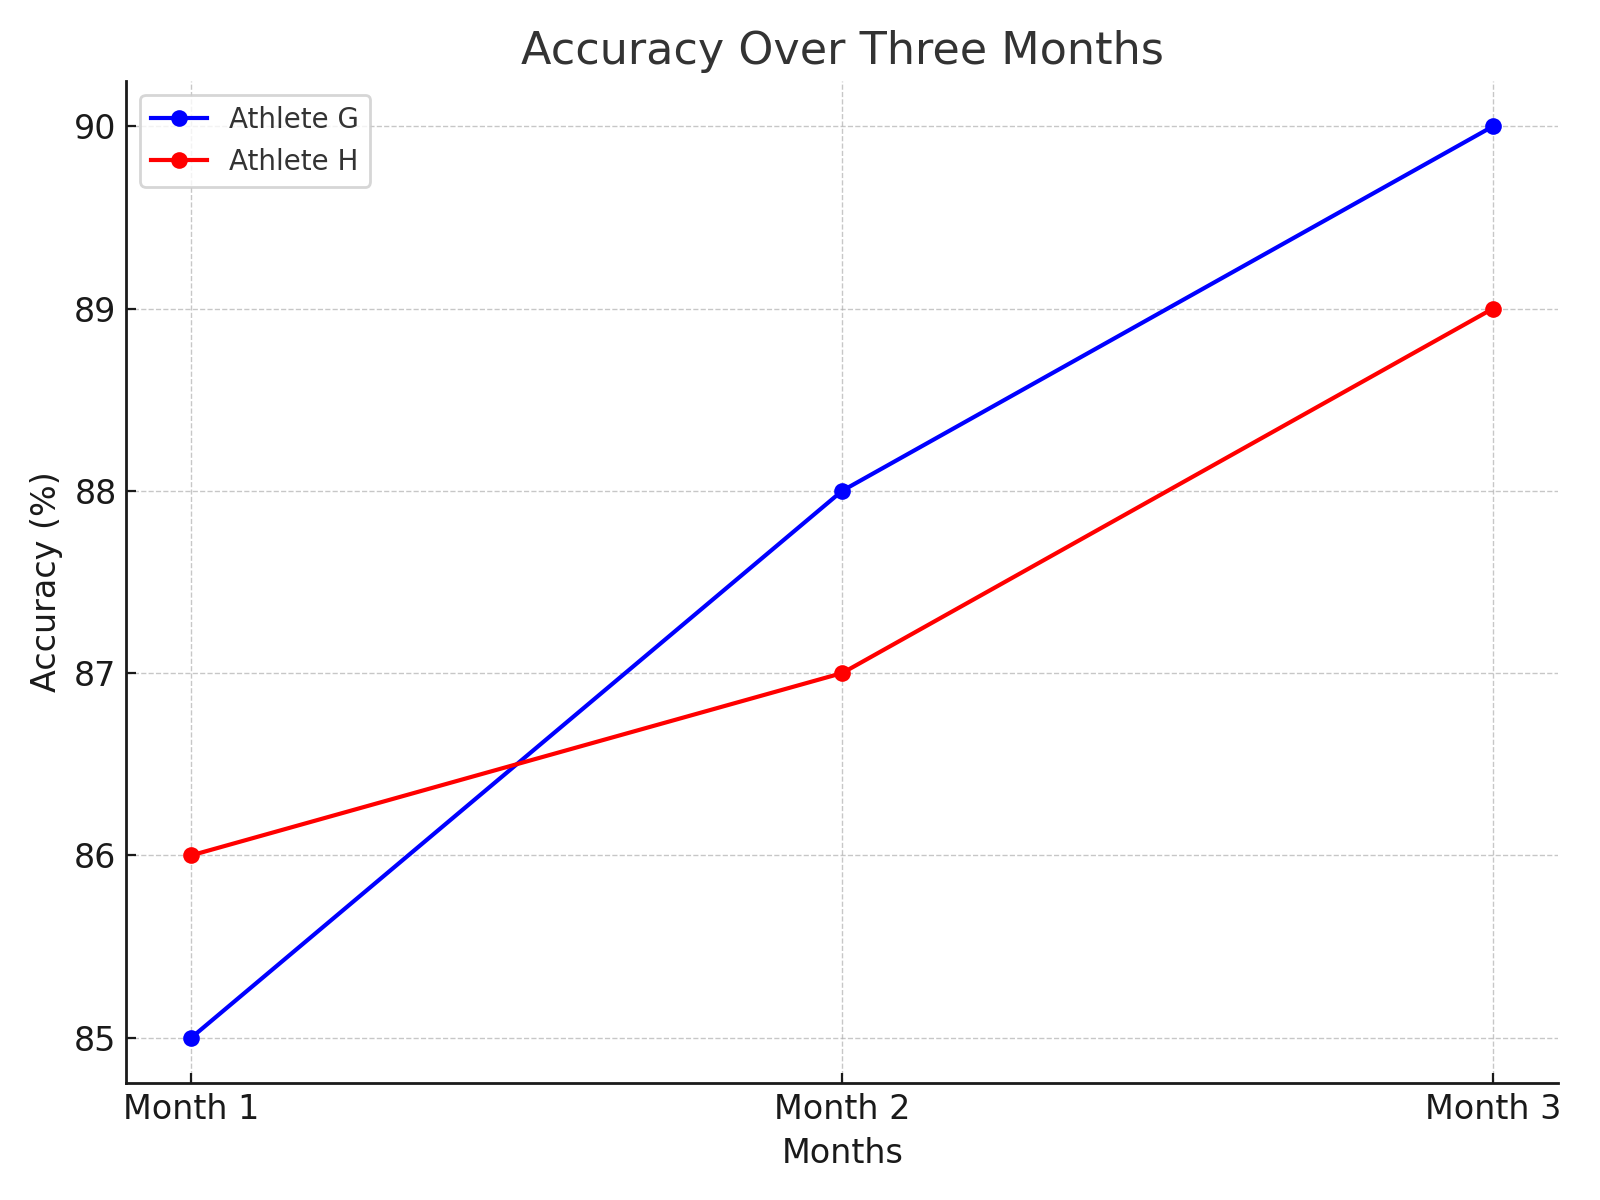
Initially, when we evaluate our athletes' performance based on the traditional metrics of reaction time and accuracy, both Athlete G and H seem to be on par with each other. Over three months, they both show commendable improvements in their average reaction times and accuracy percentages.
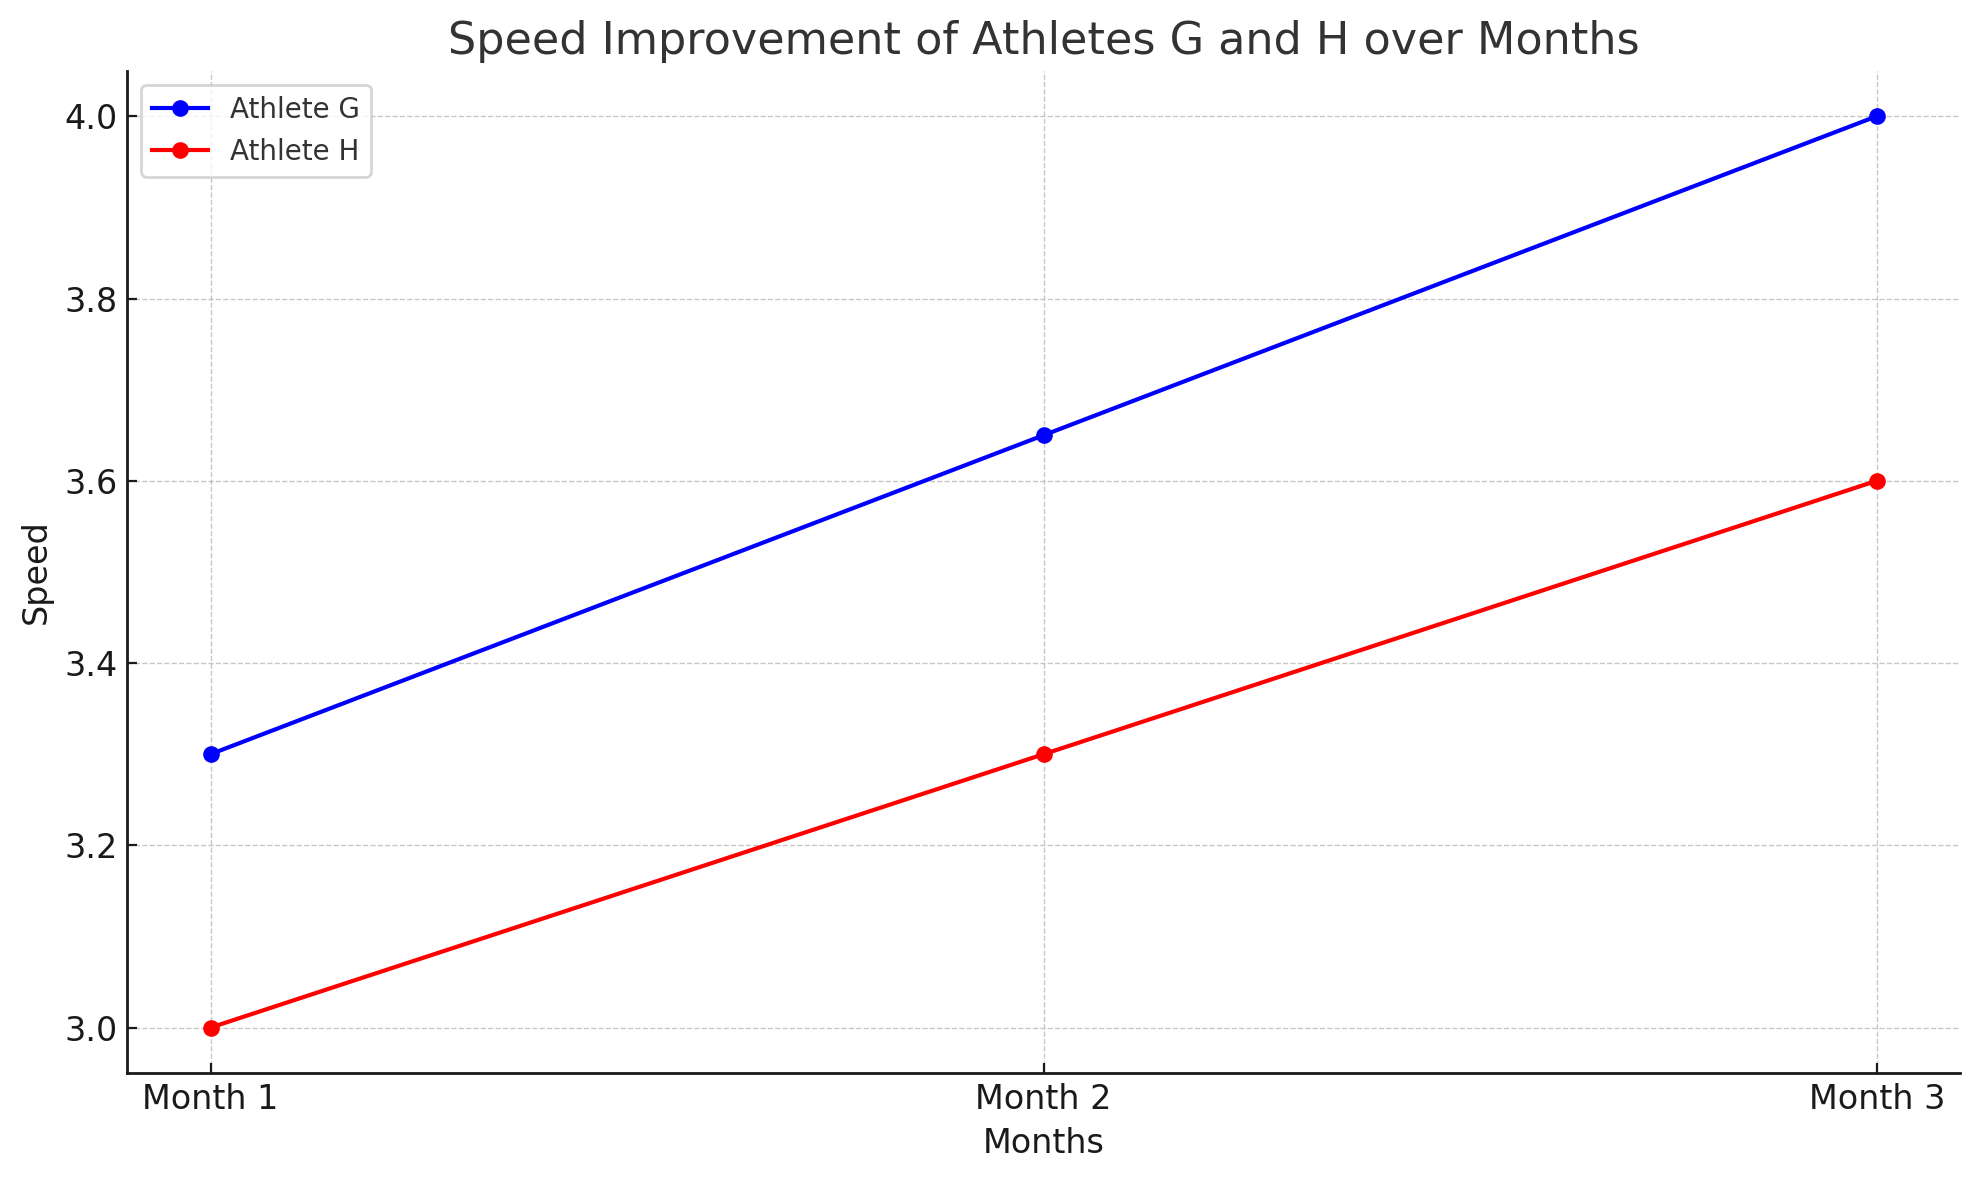
The Expanded View: Incorporating Speed
While reaction time and accuracy are fundamental metrics, they don't paint the complete picture. When we incorporate speed into our analysis, things start to shift. Though both athletes improved in reaction time and accuracy, Athlete H's speed reveals more outliers, suggesting that while they might be fast on certain occasions, they're not consistently so.
By now, it should be clear that relying solely on reaction time and accuracy can be misleading. An athlete could have a great average reaction time but might achieve this average through a mix of extremely fast and extremely slow responses. This inconsistency can be a potential problem in real-world scenarios, especially in sports where consistency is key.
Delving Deeper: Understanding Variation
Now, let's add another layer to our analysis - variation. Variation measures how much individual data points differ from the average. It's a crucial metric to consider because it provides insights into an athlete's consistency. Two athletes might have the same average reaction time, but one might show a lot of variation around this average, while the other's responses might be tightly packed around the mean.
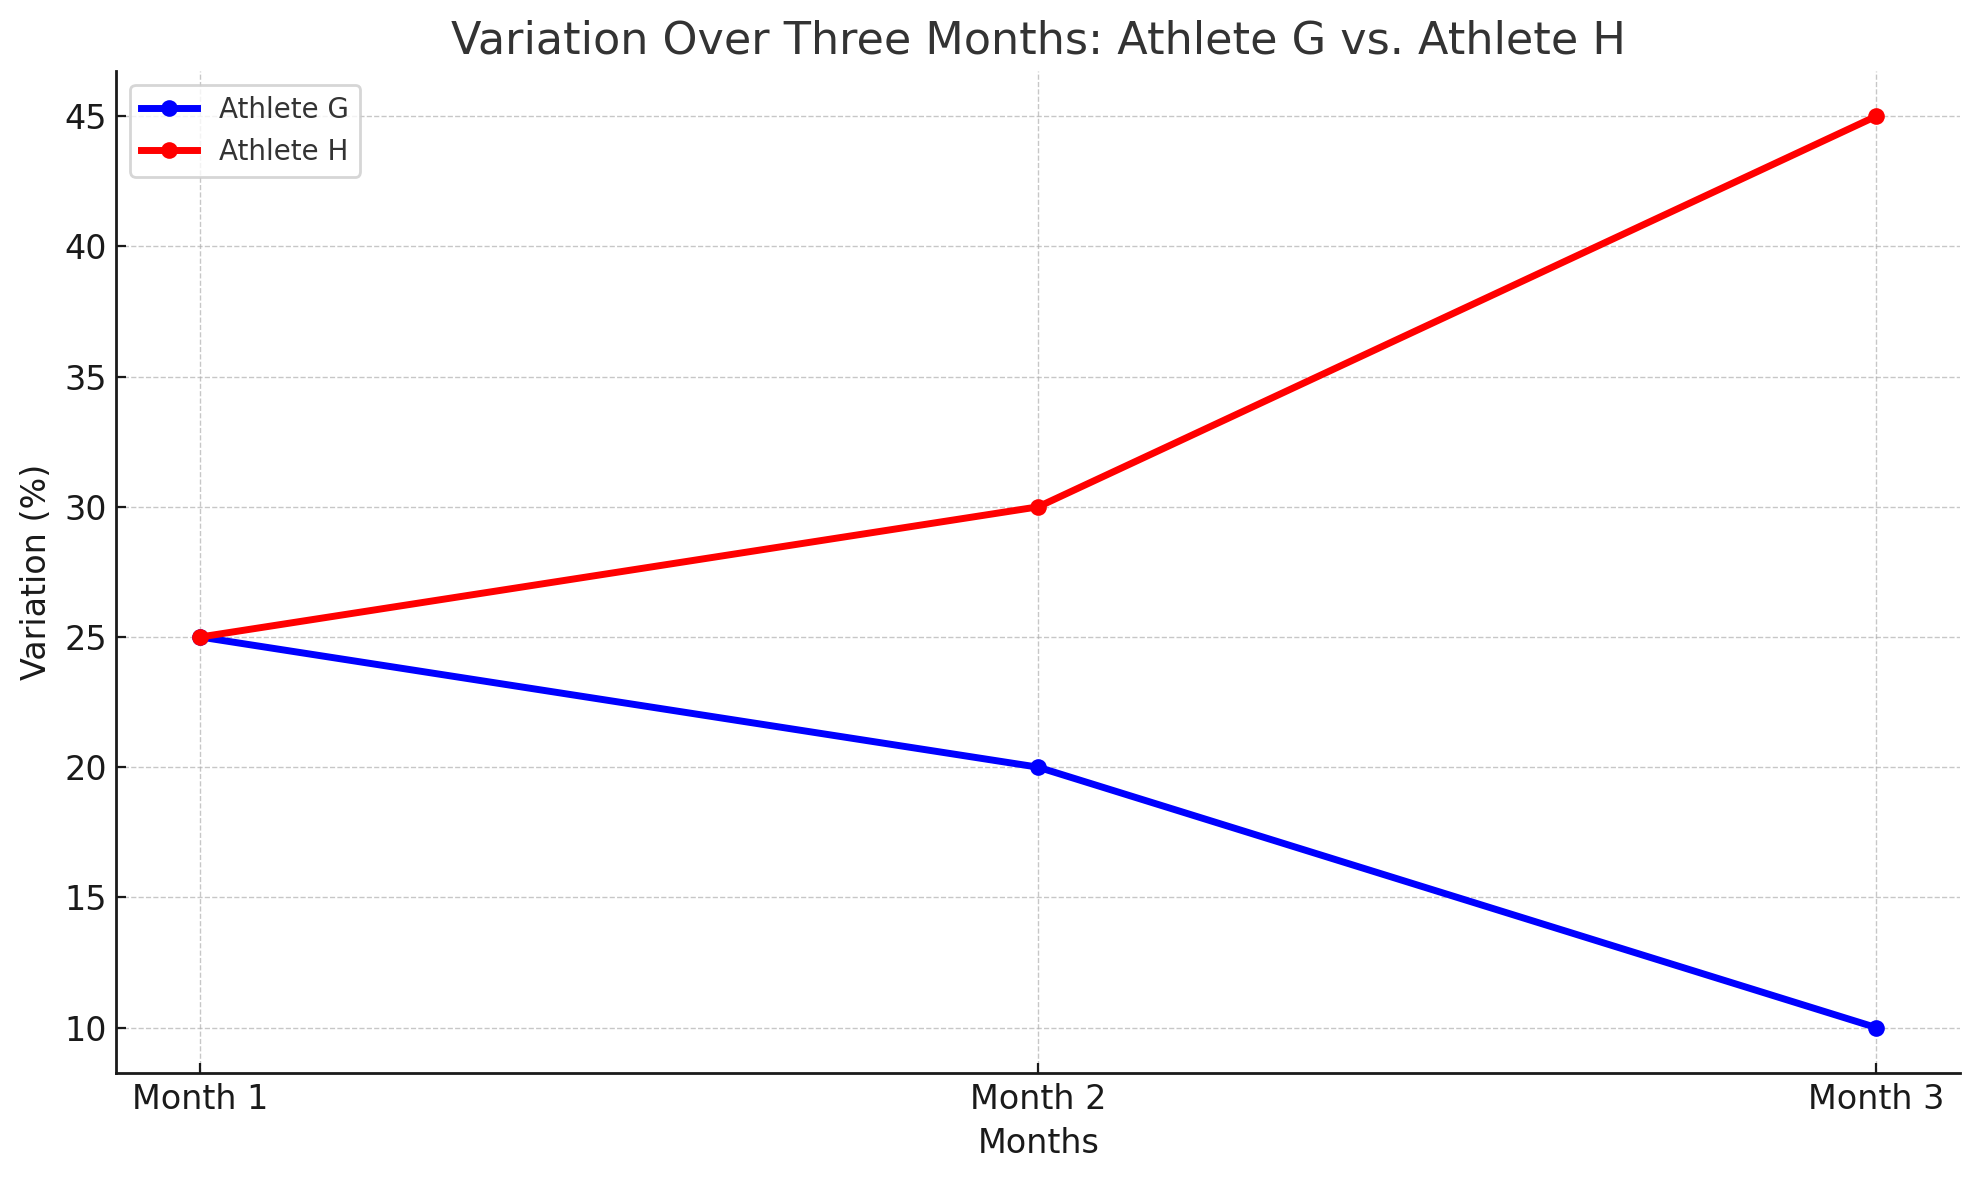
In our example, even though Athlete G and Athlete H both improved their reaction times, Athlete H's higher variation suggests more inconsistency. This difference in variation underscores the fact that while both athletes might seem to perform identically when only looking at averages, their individual performances are notably different.
Without variation, we wouldn't be able to discern this difference. It's like trying to understand a story by only reading its summary. You get the gist, but you miss out on the nuances and subtleties that give the story depth and meaning.
The Verdict
When assessing cognitive performance, it's imperative to consider multiple metrics. Reaction time and accuracy are a good starting point, but speed and variation provide the depth needed for a comprehensive analysis. By looking at all these metrics together, we can gain a holistic view of an athlete's performance, understanding not just how fast or accurate they are, but also how consistent and reliable their performances are.
In our example, Athlete G emerges as the more consistent performer, showing improvements not just in speed but also in consistency. Athlete H, despite having similar improvements in reaction time and accuracy, exhibits more inconsistency in their responses.
Wouldn't you prefer an athlete who is not only fast but also consistently so?
The data speaks for itself. But it's only when we listen to all the metrics, that we truly understand what it's saying.
To Summarize - Understanding Reaction Time: A Deep Dive
- More Than Just Reaction Time: While pivotal, reaction time alone doesn't unveil the full spectrum of an athlete's performance. It's the entry point, not the entire journey.
- The Hidden Depths of Speed & Variation: These metrics provide layers of understanding, revealing the consistencies, inconsistencies, and nuances of performance, often missed by just focusing on averages.
- Averages Can Deceive: Two athletes might have identical averages, but their individual data points, when considered with metrics like speed and variation, can tell vastly different stories.
- The Tale of Two Athletes: Athlete G and Athlete H's journey over three months emphasizes the need for a multi-metric approach. The more metrics we consider, the clearer the picture becomes.
- The Crucial Role of Variation: It's the metric that adds depth to our understanding, letting us decipher genuine improvement from mere sporadic highs.
- Interpretation is Key: Data, in its raw form, is just numbers. The real magic happens when we interpret it comprehensively, integrating metrics to form a clear, actionable narrative of performance.
🌐 Connect With Us
🌍 Soma Technologies: Engineered to enhance human performance.
📸 Instagram: Dive into our world through exclusive photos and stories.
👥 Facebook: Join our community for the latest updates and discussions.
📈 LinkedIn: Connect with us professionally and stay informed about industry news.
🎥 YouTube: Watch our latest videos, tutorials.
🐦 X: Follow us for instant updates, news, and engaging tweets.