
Optimizing a Cognitive Training Program
This guide is designed to simplify the process of optimizing a cognitive training plan. It includes straightforward explanations for interpreting key performance indicators.

This guide is designed to simplify the process of optimizing a cognitive training plan. It includes straightforward explanations for interpreting key performance indicators.
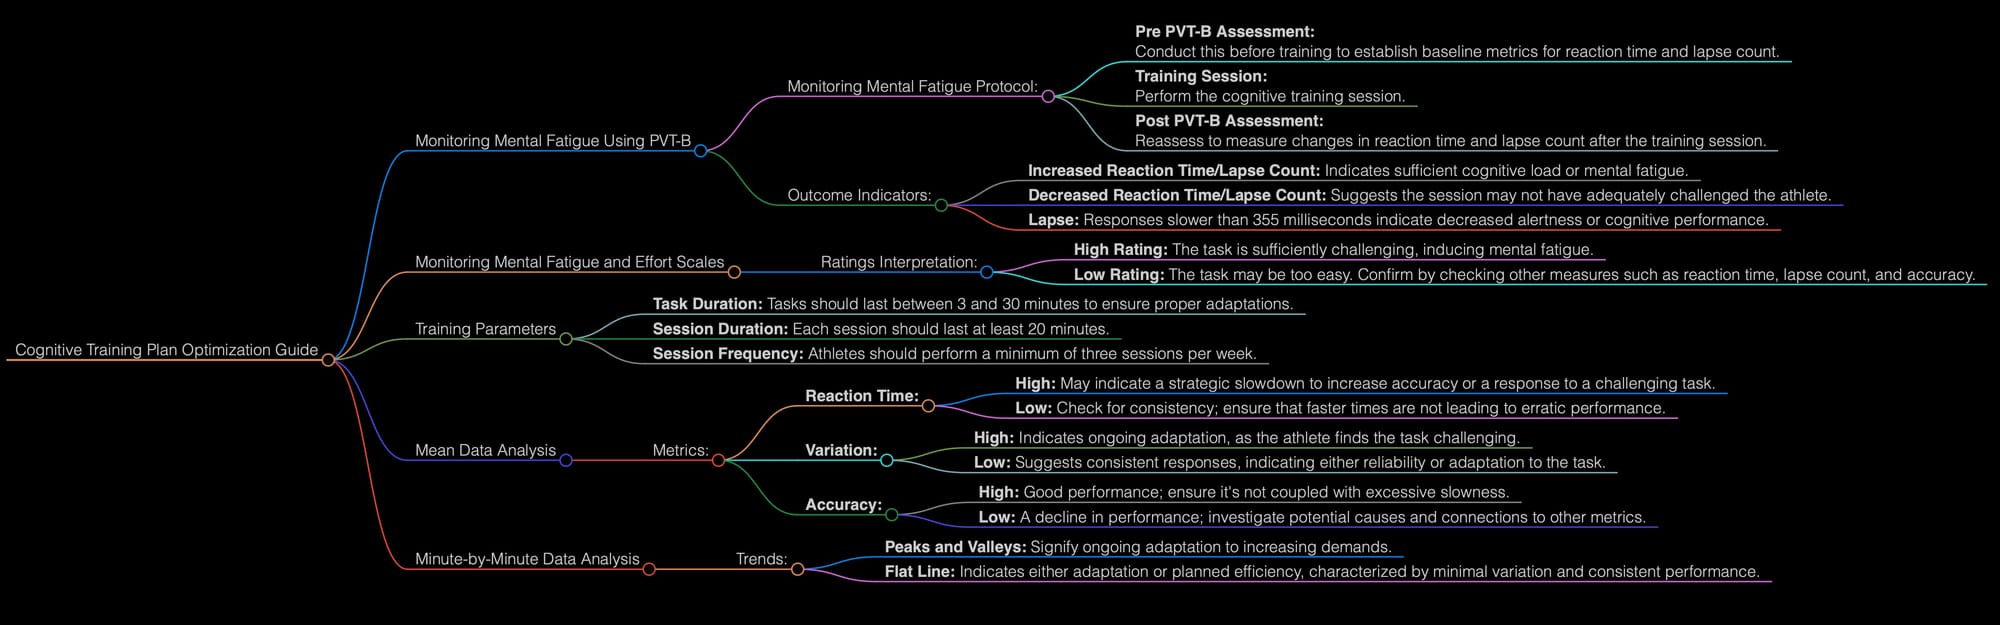
Monitoring Mental Fatigue Using PVT-B
- Pre PVT-B Assessment: Conduct this before training to establish baseline metrics for reaction time and lapse count.
- Training Session: Perform the cognitive training session.
- Post PVT-B Assessment: Reassess to measure changes in reaction time and lapse count after the training session.
Outcome Indicators:
- Increased Reaction Time/Lapse Count: Indicates that sufficient cognitive load or mental fatigue has been induced.
- Decreased Reaction Time/Lapse Count: Suggests that the session may not have adequately challenged the athlete.
- Lapse: Responses slower than 355 milliseconds indicate decreased alertness or cognitive performance.
Monitoring Mental Fatigue and Effort Scales
Ensure athletes rate their Mental Fatigue (MF) and Mental Effort (ME) levels after each task. This feedback can be used to optimize future tasks.
Ratings Interpretation:
- High Rating: The task is sufficiently challenging, inducing mental fatigue.
- Low Rating: The task may be too easy. Confirm by checking other measures such as reaction time, lapse count, and accuracy.
Training Parameters
- Task Duration: Tasks should last between 3 and 30 minutes to ensure proper adaptations.
- Session Duration: Each session should last at least 20 minutes.
- Session Frequency: Athletes should perform a minimum of three sessions per week.
Mean Data Analysis
Reaction Time:
- High: May indicate a strategic slowdown to increase accuracy or a response to a challenging task.
- Low: Check for consistency; ensure that faster times are not leading to erratic performance.
Variation:
- High: Indicates ongoing adaptation, as the athlete finds the task challenging.
- Low: Suggests consistent responses, indicating either reliability or adaptation to the task.
Accuracy:
- High: Good performance; ensure it's not coupled with excessive slowness.
- Low: A decline in performance; investigate potential causes and connections to other metrics.
Minute-by-Minute Data Analysis
- Peaks and Valleys: Signify ongoing adaptation to increasing demands.
- Flat Line: Indicates either adaptation or planned efficiency, characterized by minimal variation and consistent performance.
🌐 Connect With Us
🌍 Soma Technologies: Engineered to enhance human performance.
📸 Instagram: Dive into our world through exclusive photos and stories.
👥 Facebook: Join our community for the latest updates and discussions.
📈 LinkedIn: Connect with us professionally and stay informed about industry news.
🎥 YouTube: Watch our latest videos, tutorials.
🐦 X: Follow us for instant updates, news, and engaging tweets.