
Navigating the Maze of Cognitive Data: A Quick Guide
Grasping the subtleties of various cognitive metrics is essential. These metrics are more than just numbers; they are vital indicators of an athlete's current performance and potential areas for improvement.

Grasping the subtleties of various cognitive metrics is essential. These metrics are more than just numbers; they are vital indicators of an athlete's current performance and potential areas for improvement. This quick guide is designed to clarify these metrics, providing insights into how to interpret their changes and how they can inform your training plans.
The Importance of Individual Metrics: Each cognitive metric sheds light on different aspects of an athlete's cognitive function. Understanding these metrics individually allows coaches and trainers to create more effective, personalized training plans. It's important to approach this data with a nuanced understanding, as cognitive metrics can often be complex and multifaceted.
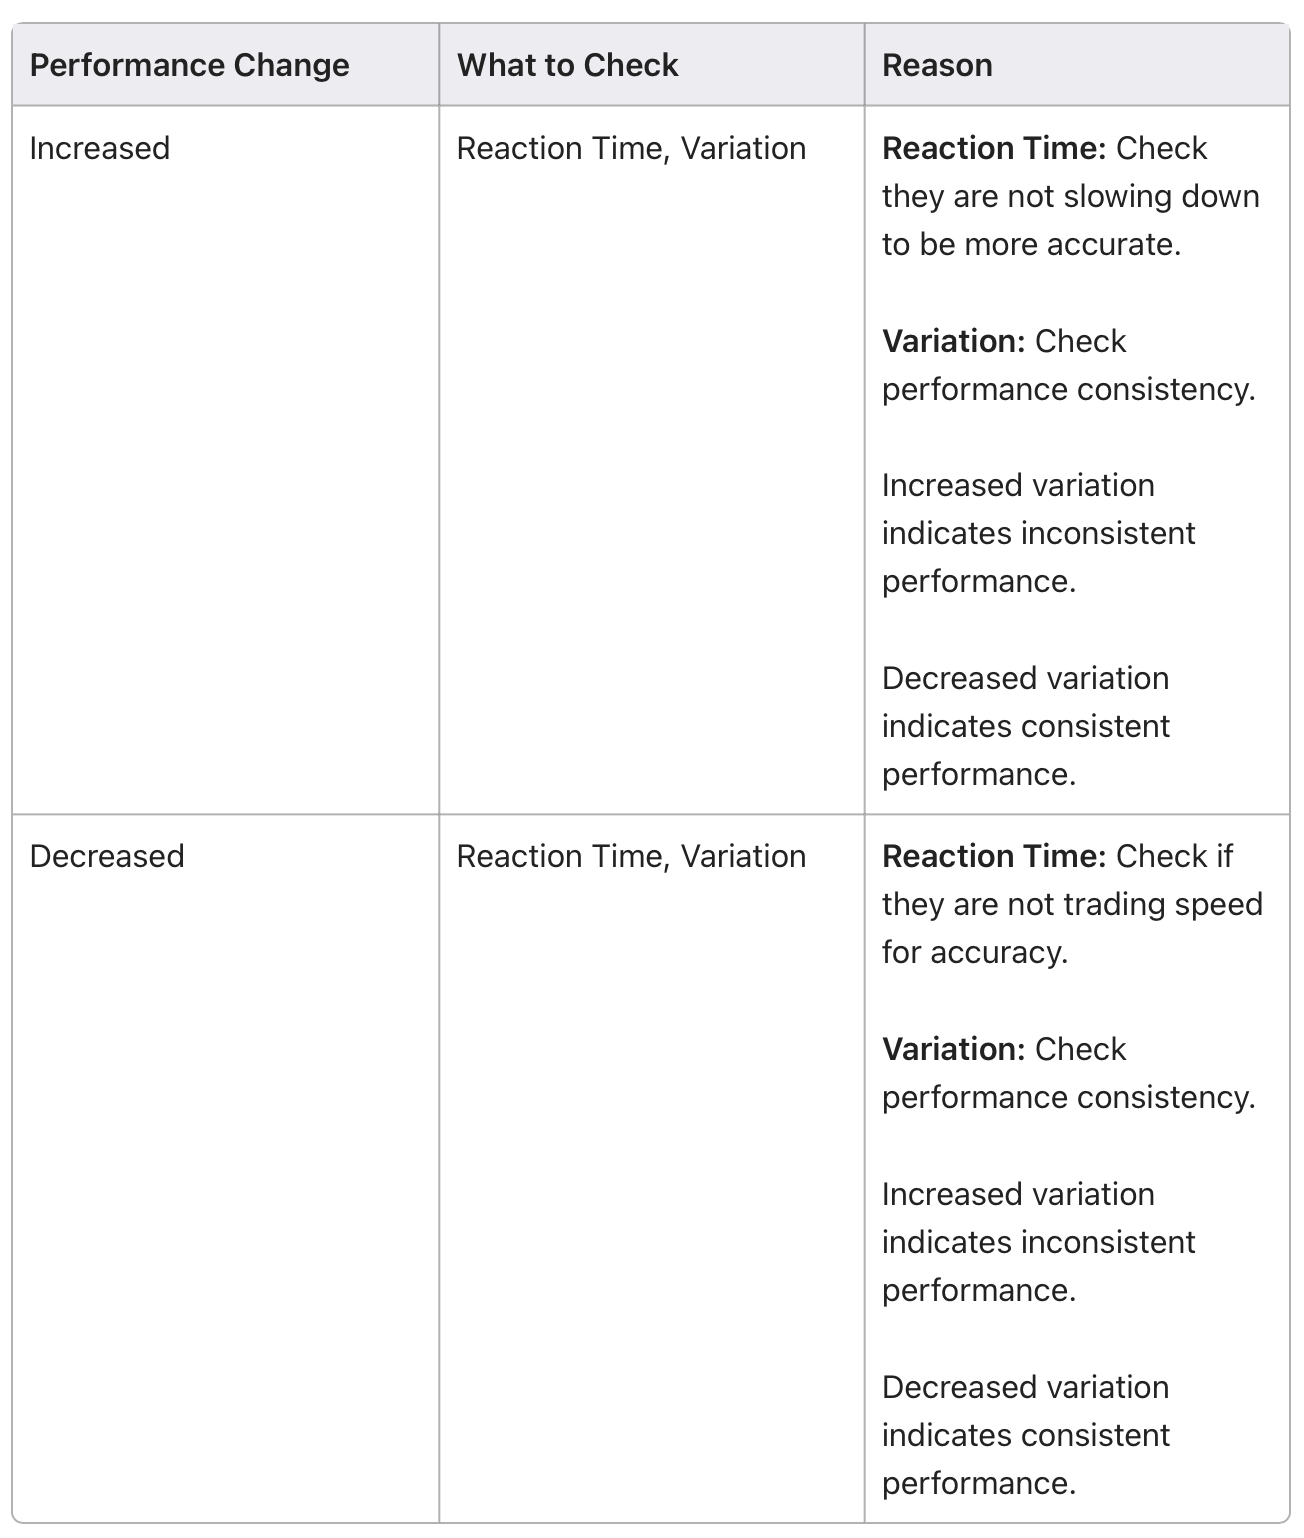
Case Study Example: Let's examine a scenario: an athlete shows a 3% decrease in reaction time at the conclusion of a training plan. While this might initially appear as a setback, it's crucial to consider the broader context. If this reduction in speed is accompanied by a 30% improvement in response consistency (variation) and a 20% increase in accuracy, the overall impact is decidedly positive. This athlete has achieved greater consistency and accuracy, with only a minimal decrease in reaction speed. Such an outcome is advantageous, indicating a refined and reliable performance.
On the other hand, an athlete who displays a 20% increase in reaction time, but also a 20% increase in response variation and a slight improvement in accuracy, poses a different situation. This indicates a quicker yet more erratic performance, which may not be desirable, especially in high-pressure situations.
Given these complexities, it’s crucial to focus on key cognitive metrics, such as:
- Reaction Time
- Variation
- Accuracy
A thorough understanding of how these metrics interact is key to devising effective training strategies. By focusing on the most significant data points, trainers and coaches can make well-informed decisions, steering athletes toward enhanced consistency and precision in their performance. In cognitive training, each piece of data is a puzzle piece in the larger picture of an athlete's development.
Mean Cognitive Data
Metric: Reaction Time
Metric: Speed
Metric: Variation
Metric: RCS
Metric: Accuracy
Minute on Minute (MoM) Cognitive Data
Minute on Minute (MoM) insights mark a significant leap forward. Moving past the limitations of average data, MoM provides a detailed, minute-by-minute exploration of performance metrics. It's akin to switching from a wide-angle lens to a high-resolution zoom, offering a comprehensive, moment-to-moment view of an athlete's performance. This detailed perspective transforms MoM from a simple analytical tool to a pivotal element in sophisticated, in-depth athlete assessment.
Deciphering the Language of MoM Data: Grasping MoM data is similar to mastering a new language – one that speaks intricately about performance dynamics. Let's demystify this together.
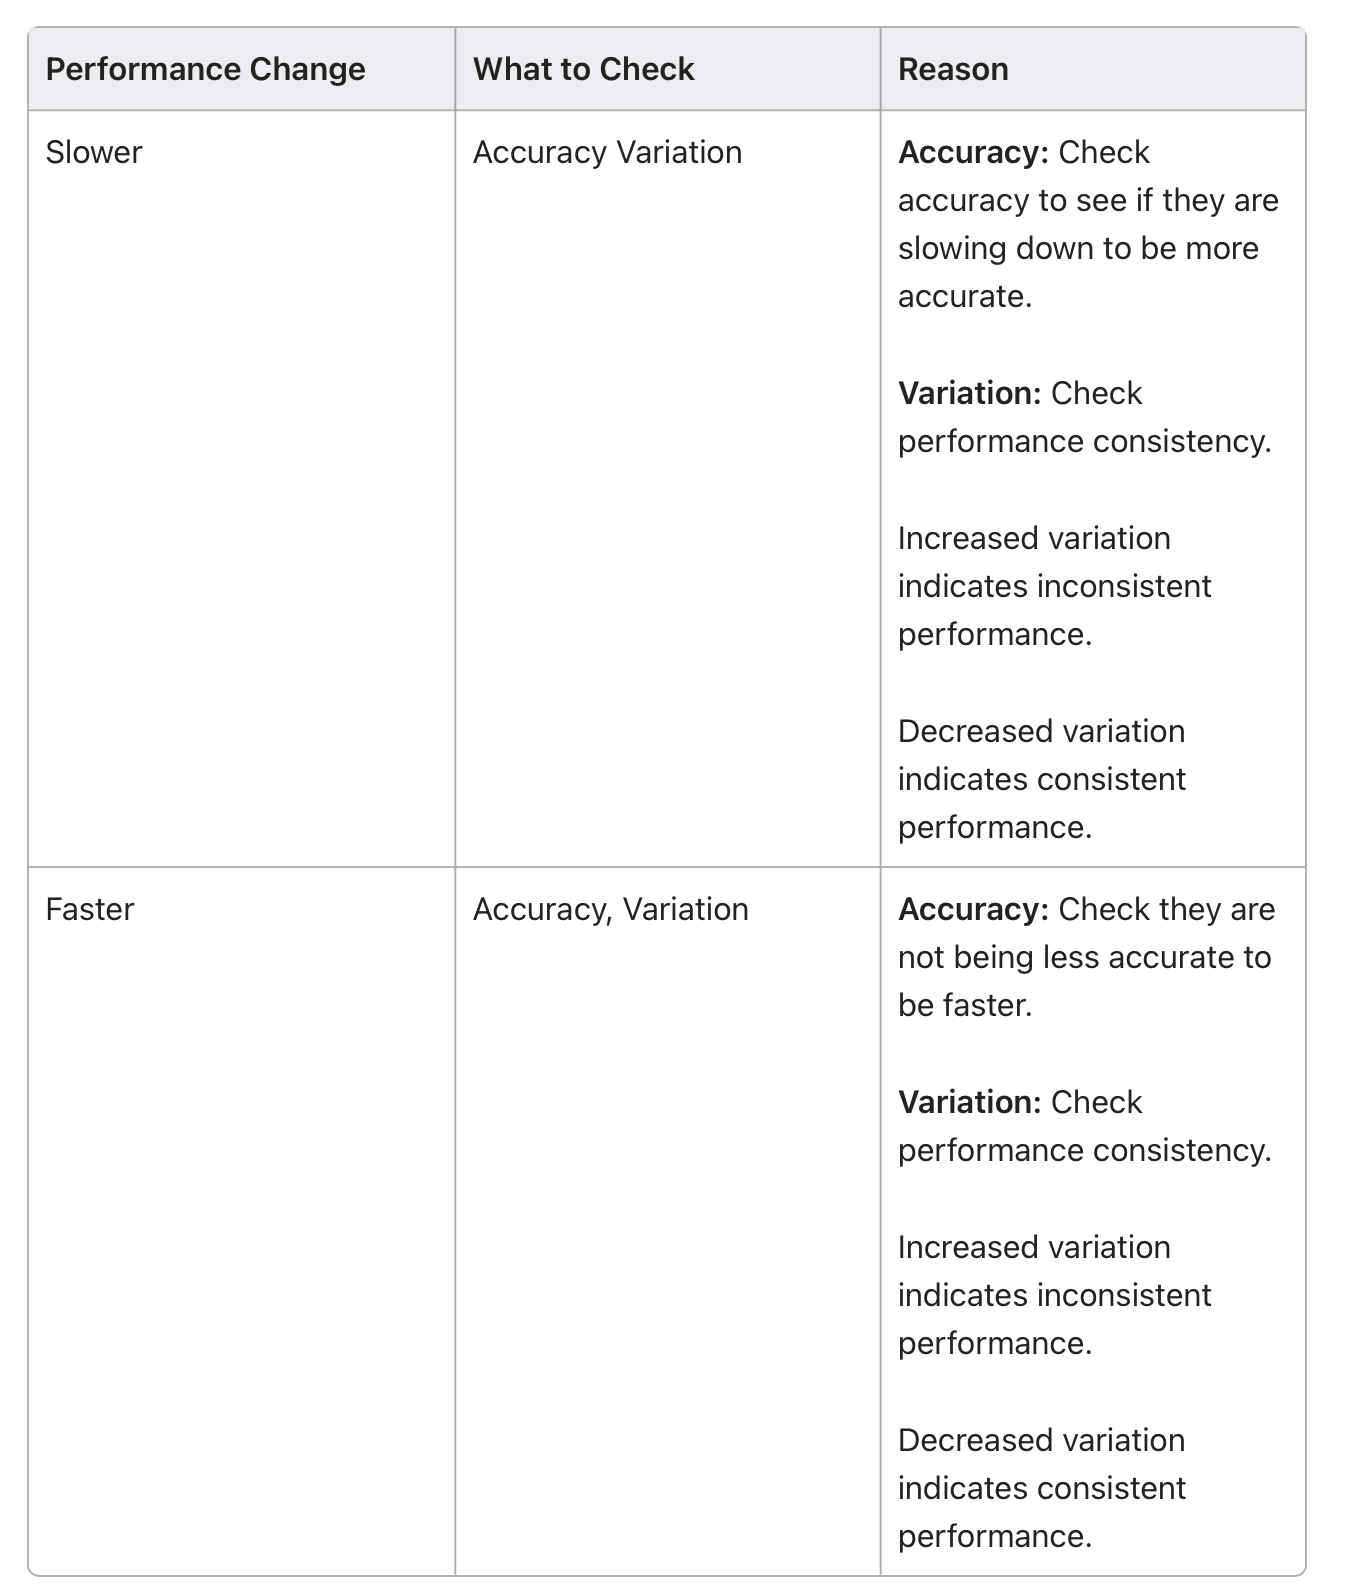
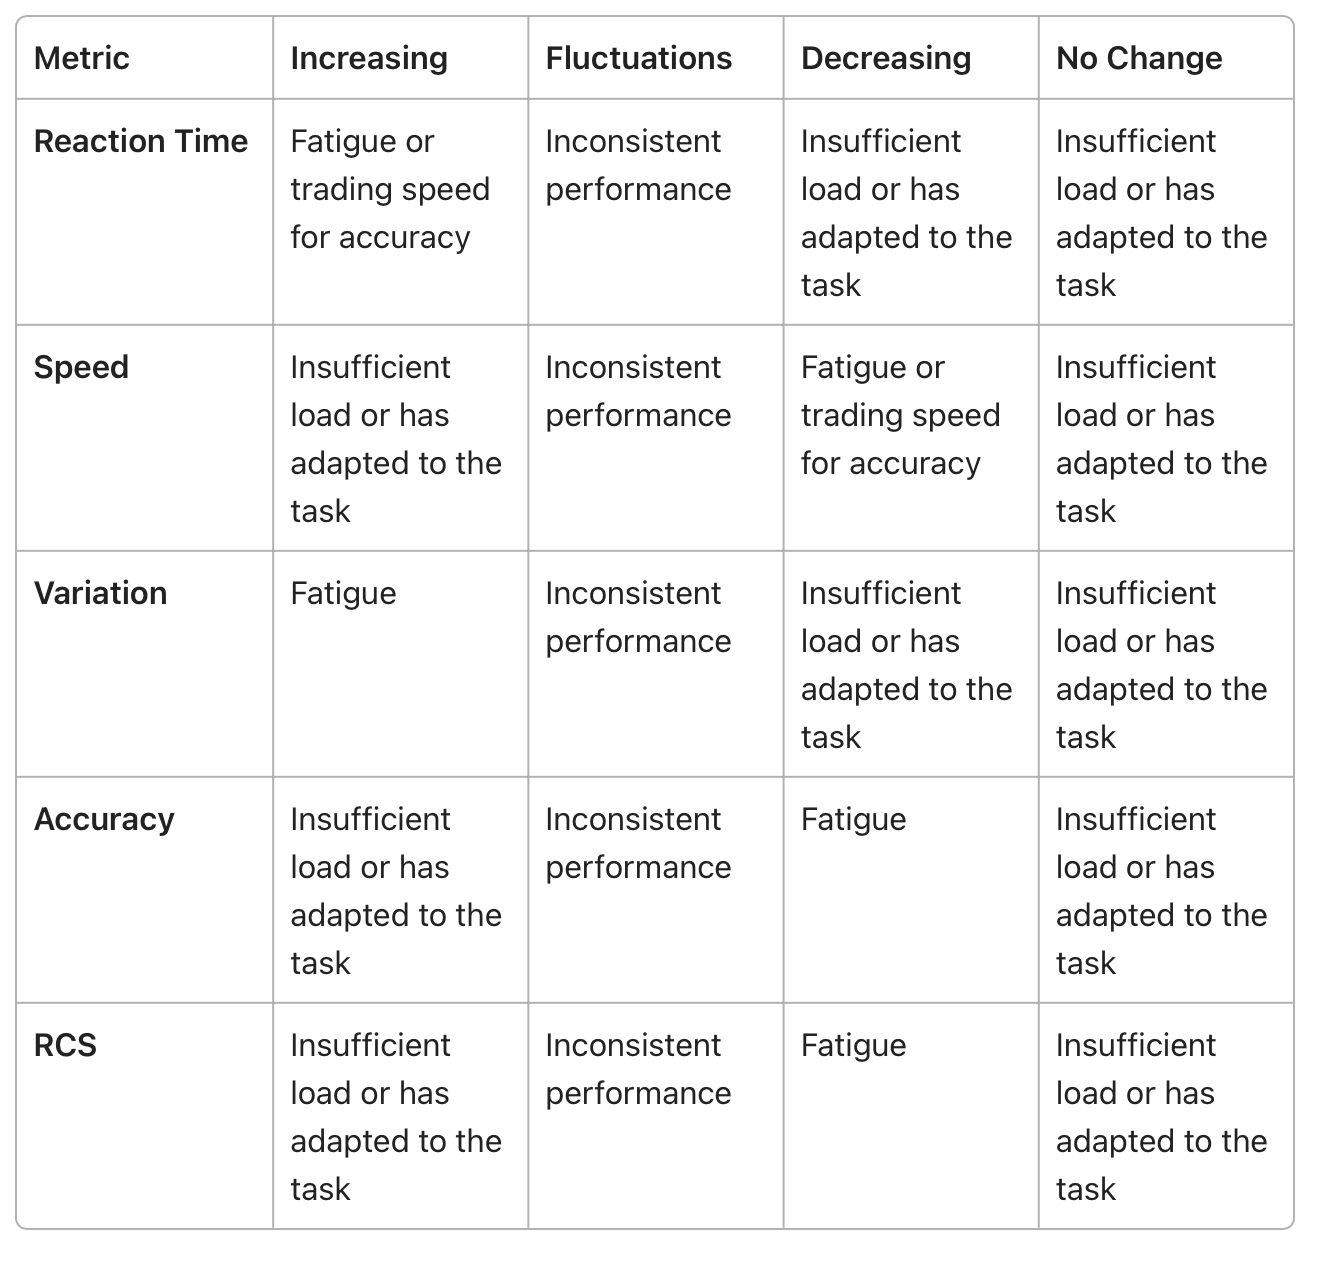
Take reaction time, for example. When you notice it increasing as minutes pass, it could be hinting at the athlete's growing fatigue, suggesting a possible compromise between speed and precision.
However, when reaction times are erratic, what's the story there? Such fluctuations might signal inconsistent performance, an area to be addressed. Every metric, be it speed, accuracy, or variation, tells a part of the athlete's overall story. Through careful MoM analysis, we piece together a complete picture, shining a light on both the strengths and areas in need of attention. This methodical approach is akin to investigative work, guiding us toward more effective, bespoke training plans.
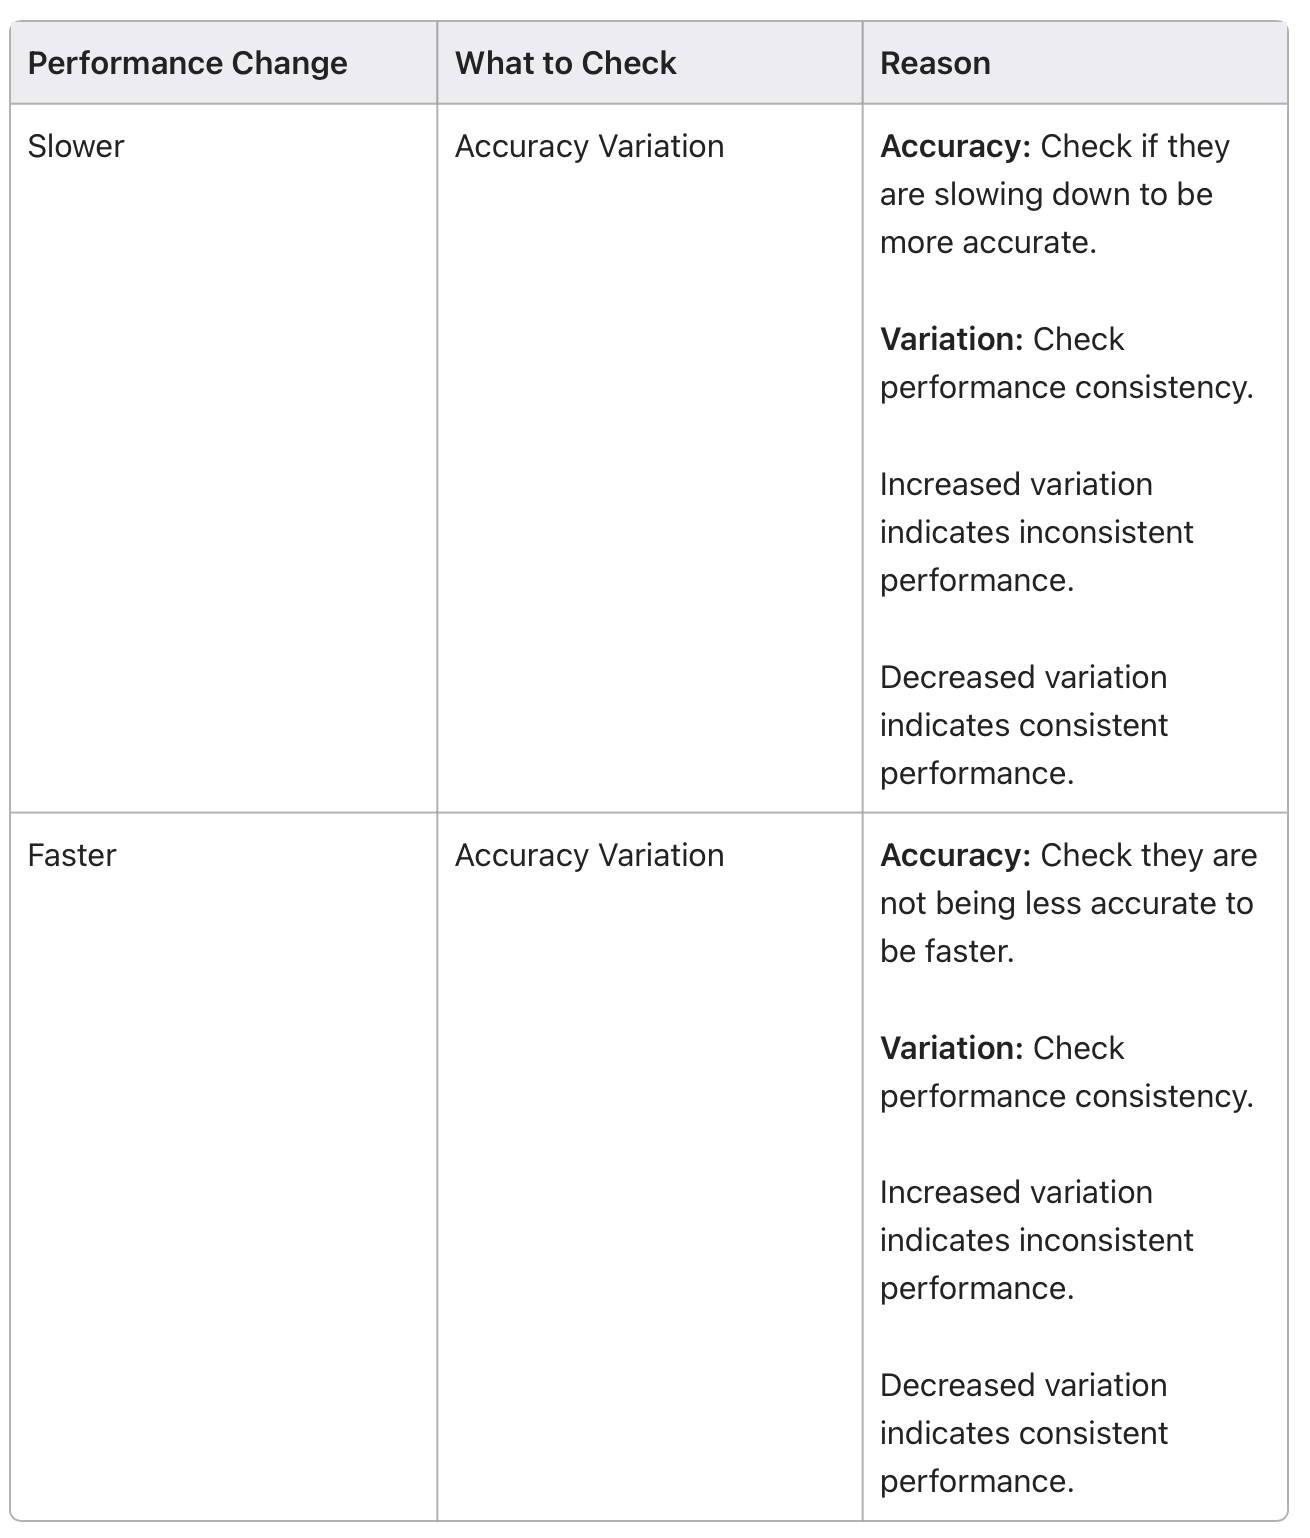
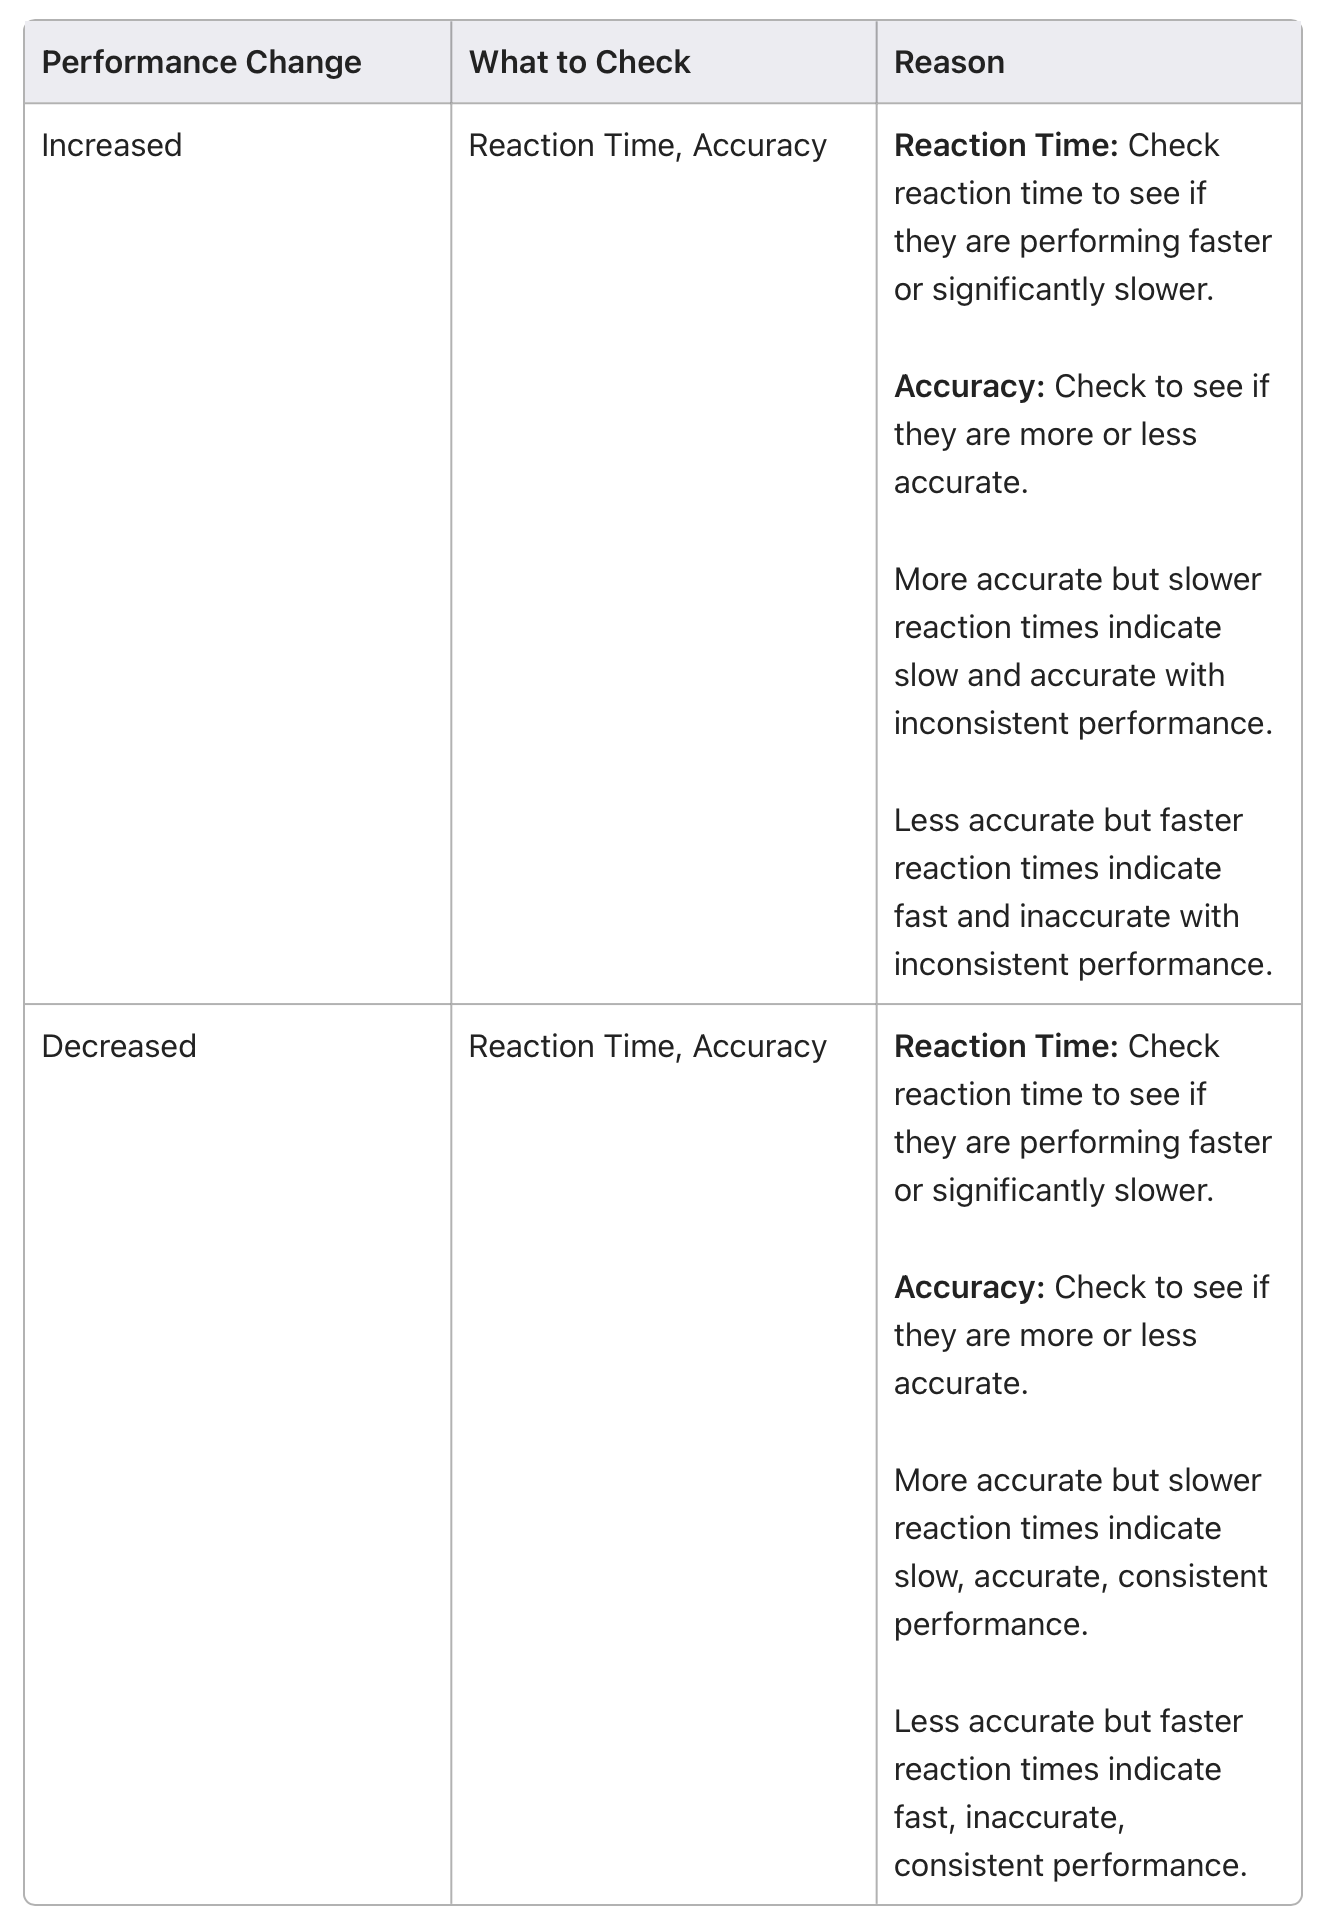
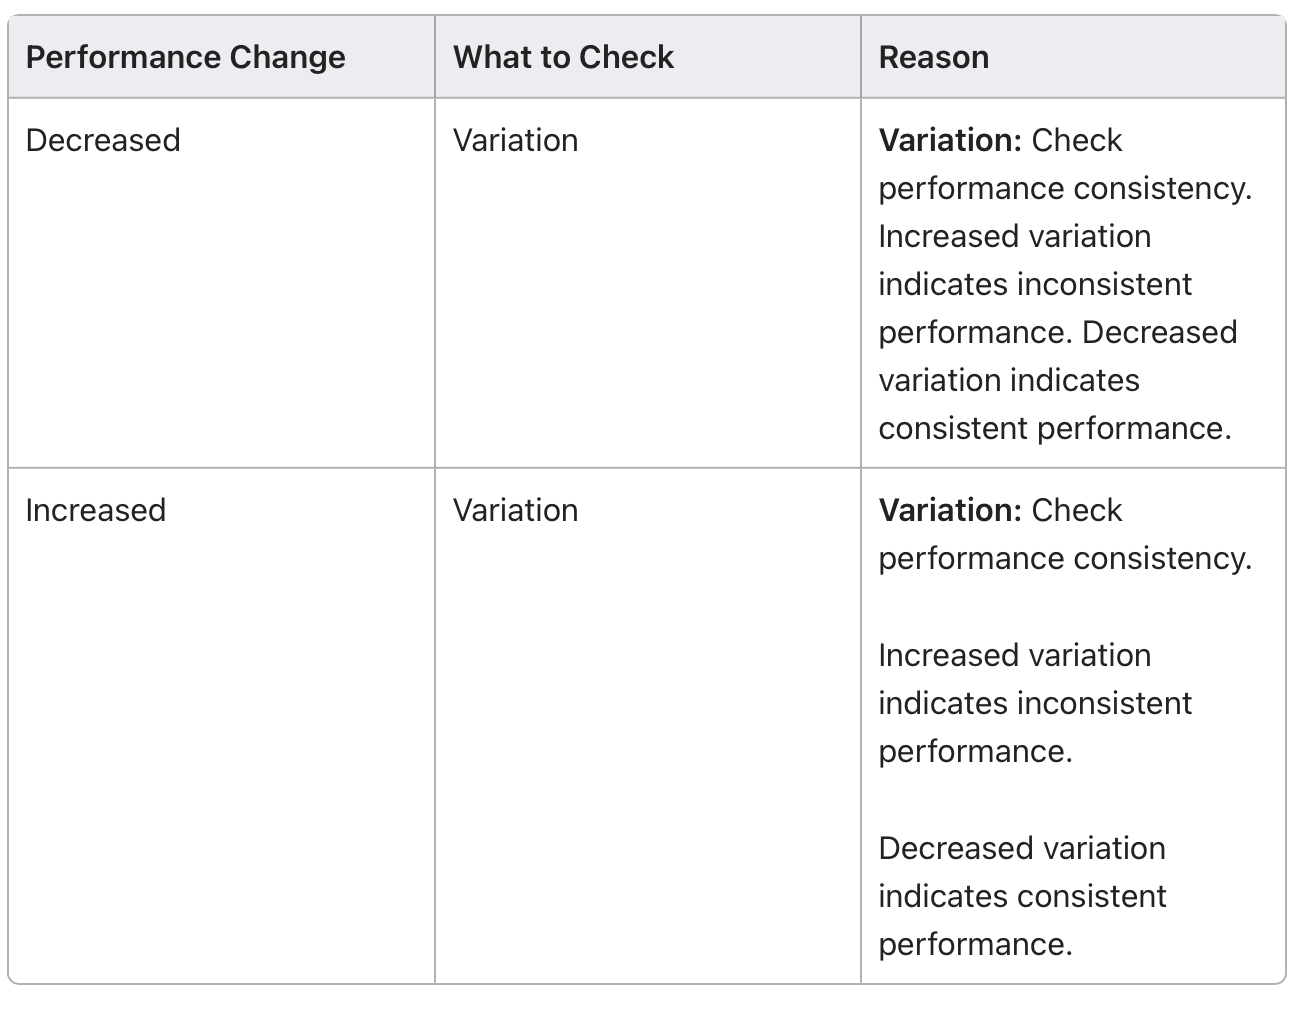
Unraveling the Essence of MoM Monitoring: In the nuanced process of MoM analysis, the comprehension of each metric becomes critical. Each metric acts as a unique prism, revealing various facets of an athlete's performance, and often uncovering details that might be obscured by average data.
Please find below a table that meticulously breaks down each metric, providing clear explanations of what it signifies when a metric is increasing, decreasing, fluctuating, or showing no change. This table is an essential tool for interpreting the nuances of athletic performance, offering you a clearer perspective on how to adapt and optimize your training strategies according to these varied metric behaviors.
🌐 Connect With Us
🌍 Soma Technologies: Engineered to enhance human performance.
📸 Instagram: Dive into our world through exclusive photos and stories.
👥 Facebook: Join our community for the latest updates and discussions.
📈 LinkedIn: Connect with us professionally and stay informed about industry news.
🎥 YouTube: Watch our latest videos, tutorials.
🐦 X: Follow us for instant updates, news, and engaging tweets.