
Optimal Cognitive Performance Hinges On Clear Benchmarks
Helping individuals achieve peak performance requires a deep understanding of their cognitive abilities. By analyzing a range of metrics, we gain insight into a person’s developmental progress. This analysis is essential in crafting a personalized performance profile.
Helping individuals achieve peak performance requires a deep understanding of their cognitive abilities. By analyzing a range of metrics, we gain insight into a person’s developmental progress. This analysis is essential in crafting a personalized performance profile.
Cognitive Performance Explained
Cognitive performance is like a triangle with three points: speed, accuracy, and consistency. The goal is for someone to increase their response speed without sacrificing accuracy or consistency. Yet, it’s a balancing act, as adjustments to speed often mean trade-offs with consistency.
The Interplay Between Speed and Consistency
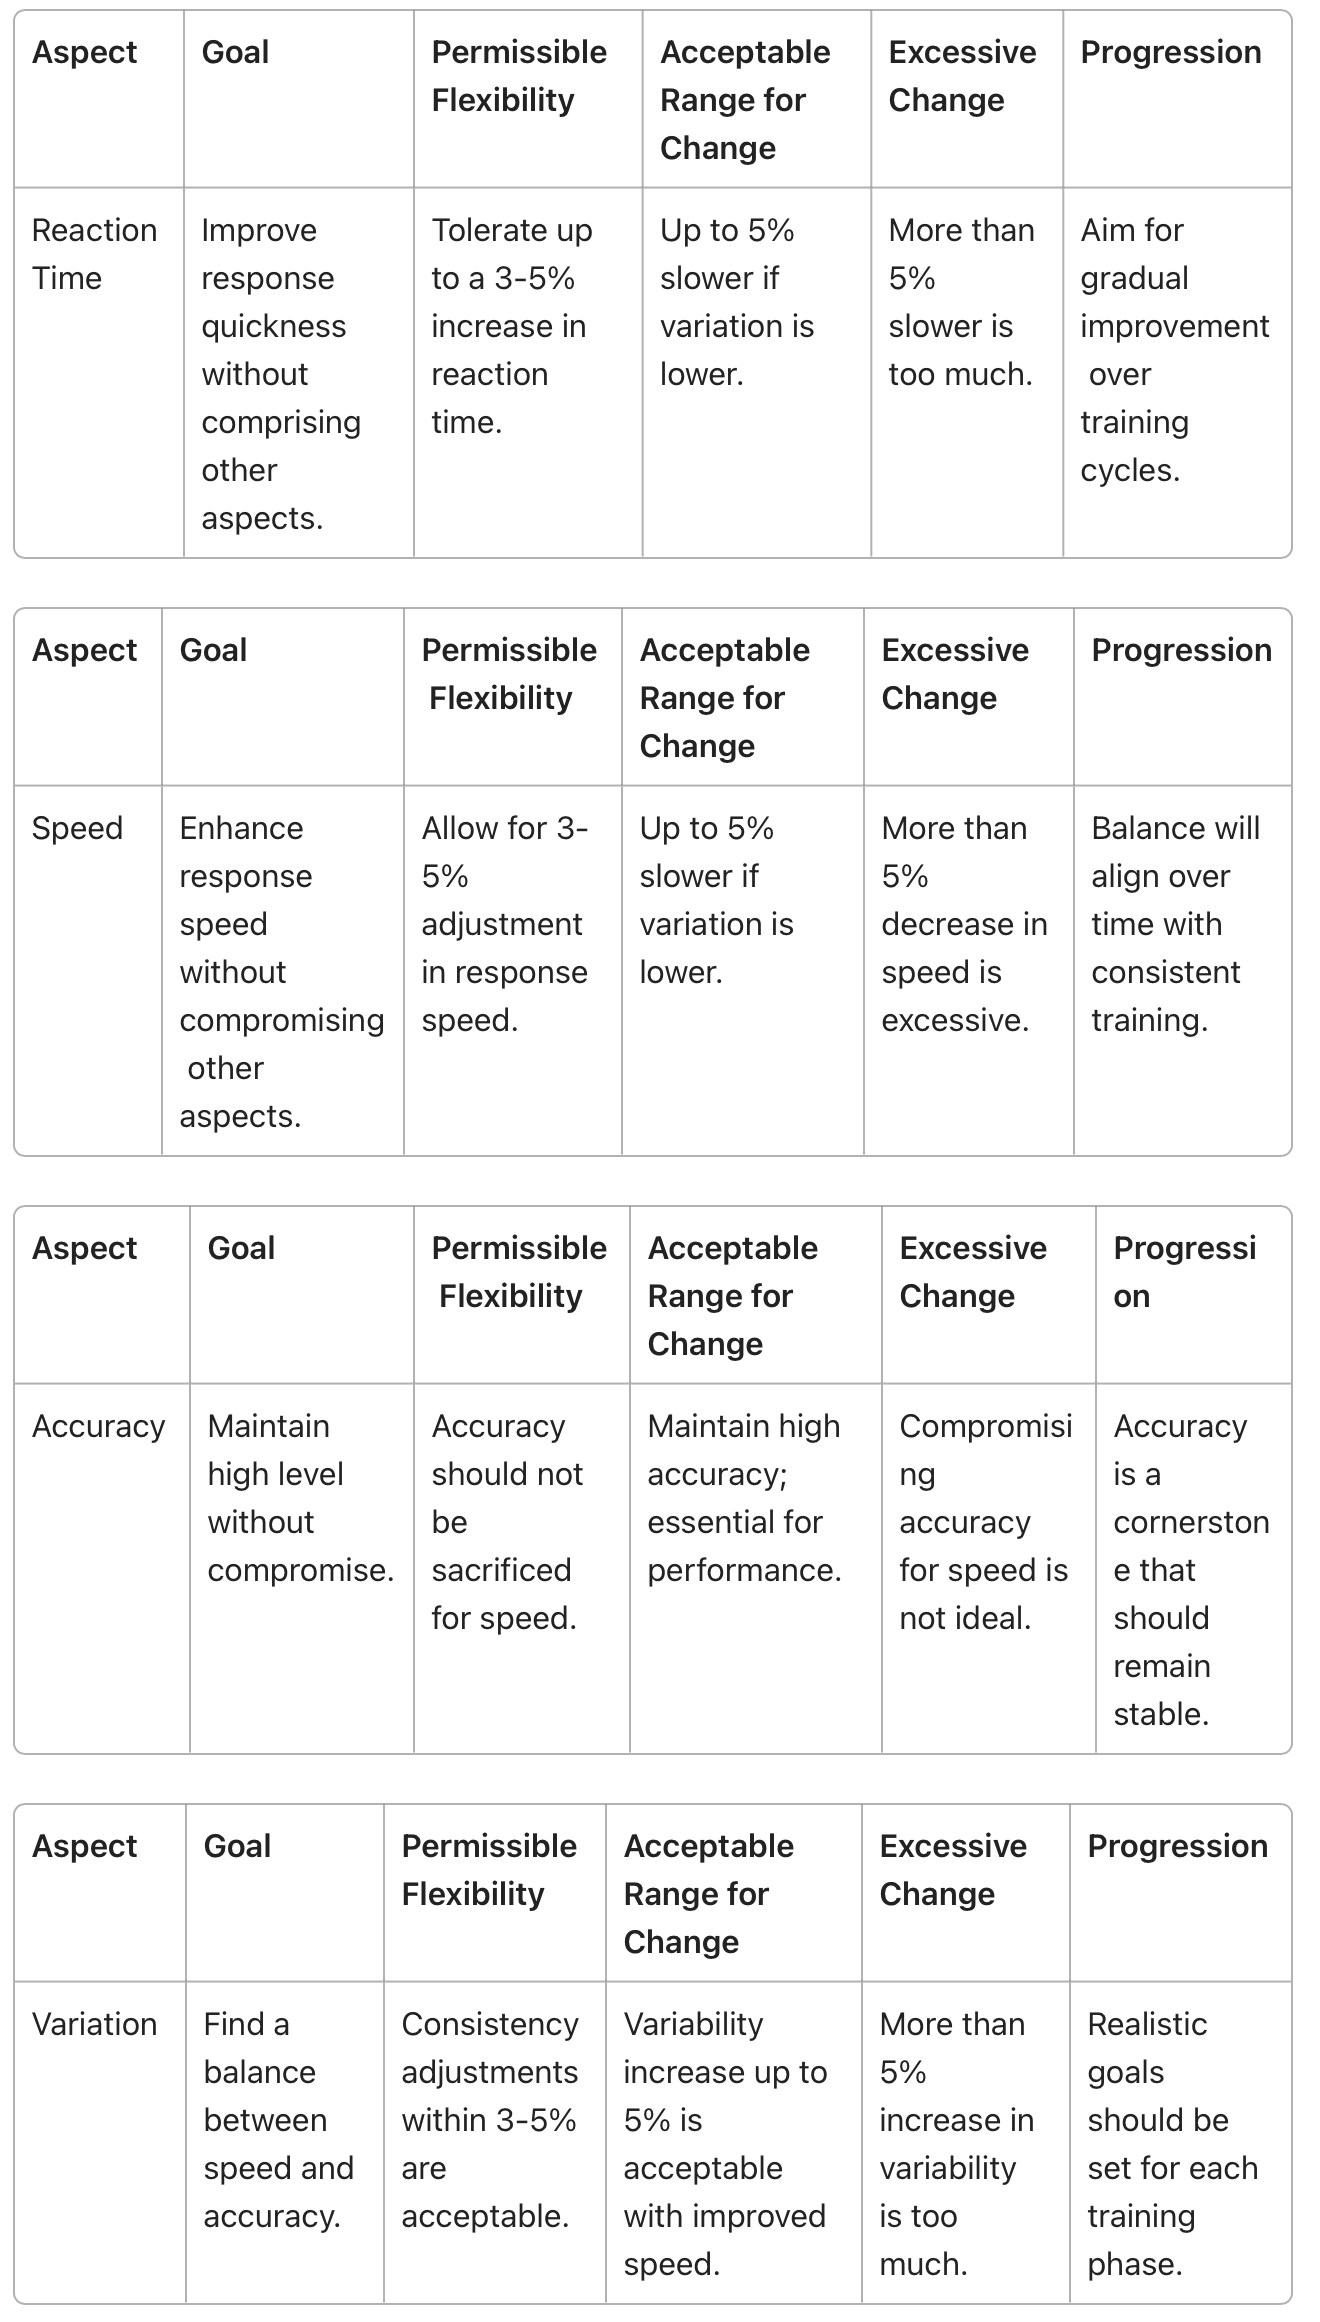
Optimal cognitive performance hinges on clear benchmarks. We suggest a 3-5% adjustment margin in speed and consistency to achieve the right balance. For example, a reaction time that's up to 5% slower is manageable if it means the individual is more consistent. But anything over a 5% decrease might be a sign of them slowing down too much.
If a person's variability goes up by as much as 5% and their reaction time improves markedly, it indicates quicker cognitive processing. However, an increase in variability over 5% is too much. With ongoing training, a balance between speed, consistency, and accuracy is achievable. Nonetheless, it's vital to set realistic goals in each training phase, accepting that data may have its imperfections.
Key Metrics for Cognitive Performance:
- Reaction Time: A vital metric of how fast an individual can respond. Reaction time alone may not fully capture an individual's cognitive performance due to its high variability.
- Speed: Provides a more precise aspect of performance, normalizing data distribution and minimizing the impact of outliers.
- Accuracy: Reflects the precision an individual exhibits while performing a task, indicating how accurately they execute the required actions.
- Variation: Used to understand the variability in an individual's responses, indicating the consistency of performance.
The below tables concisely summarize each key metric for understanding cognitive performance.
Analyzing Cognitive Baseline Data
In this example, improvements are evident in most metrics across a variety of tasks. However, there was a noticeable decline in both accuracy and consistency in the Sustained Attention and Incongruent Flanker tasks. Specifically, the Incongruent Flankers task showed a 26% decrease in accuracy and a 13% increase in variation, while the Sustained Attention task experienced a 5% rise in variation. Nevertheless, when considering the collective data from all tasks, the overall trend appears positive.
It's crucial to acknowledge that data is never flawless, and it's important to evaluate the results from each individual task against the overall baseline.
This analysis is key to identifying the athlete's cognitive strengths and areas requiring improvement, which can then be strategically addressed in the subsequent training plan.
Overall Baseline
Metric | Pre | Post | Result (%) |
Reaction Time | 763ms | 544ms | 28.60% |
Speed | 1.70 | 2.13 | 25.18% |
Accuracy | 60.88% | 69.25% | 8.38% |
Variation | 38% | 29.50% | 8.50% |
RCS | 1.08 | 1.69 | 56.61% |
Incongruent Flanker
Metric | Pre | Post | Result (%) |
Reaction Time | 415ms | 359ms | 13.49% |
Speed | 2.61 | 3.21 | 22.99 |
Accuracy | 51% | 25% | 26% |
Variation | 34% | 47% | 13% |
RCS | 2.17 | 2.51 | 15.67% |
Sustained Attention
Metric | Pre | Post | Result (%) |
Reaction Time | 557ms | 533ms | 7.63% |
Speed | 1.75 | 1.92 | 9.71% |
Accuracy | 23.5% | 72% | 49% |
Variation | 11% | 16% | 5% |
RCS | 0.43 | 1.38 | 220.93% |
Colour Shape Task
Metric | Pre | Post | Result (%) |
Reaction Time | 1211ms | 734ms | 39.39% |
Speed | 0.93 | 1.44 | 54.84% |
Accuracy | 81% | 90% | 9% |
Variation | 36% | 25% | 11% |
RCS | 0.67 | 1.23 | 83.58% |
Flanker Compatibility
Metric | Pre | Post | Result (%) |
Reaction Time | 849ms | 553ms | 34.86% |
Speed | 1.50 | 1.93 | 28.67% |
Accuracy | 88% | 90% | 2% |
Variation | 71% | 30% | 41% |
RCS | 1.04 | 1.63 | 56.73% |
🌐 Connect With Us
🌍 Soma Technologies: Engineered to enhance human performance.
📸 Instagram: Dive into our world through exclusive photos and stories.
👥 Facebook: Join our community for the latest updates and discussions.
📈 LinkedIn: Connect with us professionally and stay informed about industry news.
🎥 YouTube: Watch our latest videos, tutorials.
🐦 X: Follow us for instant updates, news, and engaging tweets.