
The Illusion of Improvement in Cognitive Performance
Ignoring variability risks misleading us into believing an athlete is performing better—or worse—than they actually are.
Understanding fluctuations in cognitive metrics isn't merely about nitpicking data; it's about gaining a true measure of an athlete's capabilities. Ignoring variability risks misleading us into believing an athlete is performing better—or worse—than they actually are. This blog delves into response variability, highlighting why a nuanced approach to analyzing these fluctuations is crucial for accurately assessing and enhancing an athlete's training and performance. Variability is a natural part of any data set. However, in the domain of cognitive performance, recognizing and interpreting these fluctuations can be the difference between good and great. You might think your athlete is improving, when in fact, they might be the same or even regressing.
The Deceptive Nature of Averages in Cognitive Performance
Averages are frequently the preferred metric for evaluating performance, offering what seems to be a straightforward method to quantify an athlete's capabilities. However, this simplicity can be misleading. Averages tend to smooth over the peaks and valleys of performance data, effectively masking the variability in responses.
For instance, calculating an athlete's average reaction time might appear to be a dependable way to assess their performance. Yet, this method has a notable drawback: it fails to consider outliers or the variability between trials. A handful of exceptionally quick or slow reactions can skew the average, thus presenting an inaccurate portrayal of an athlete's consistent performance level.
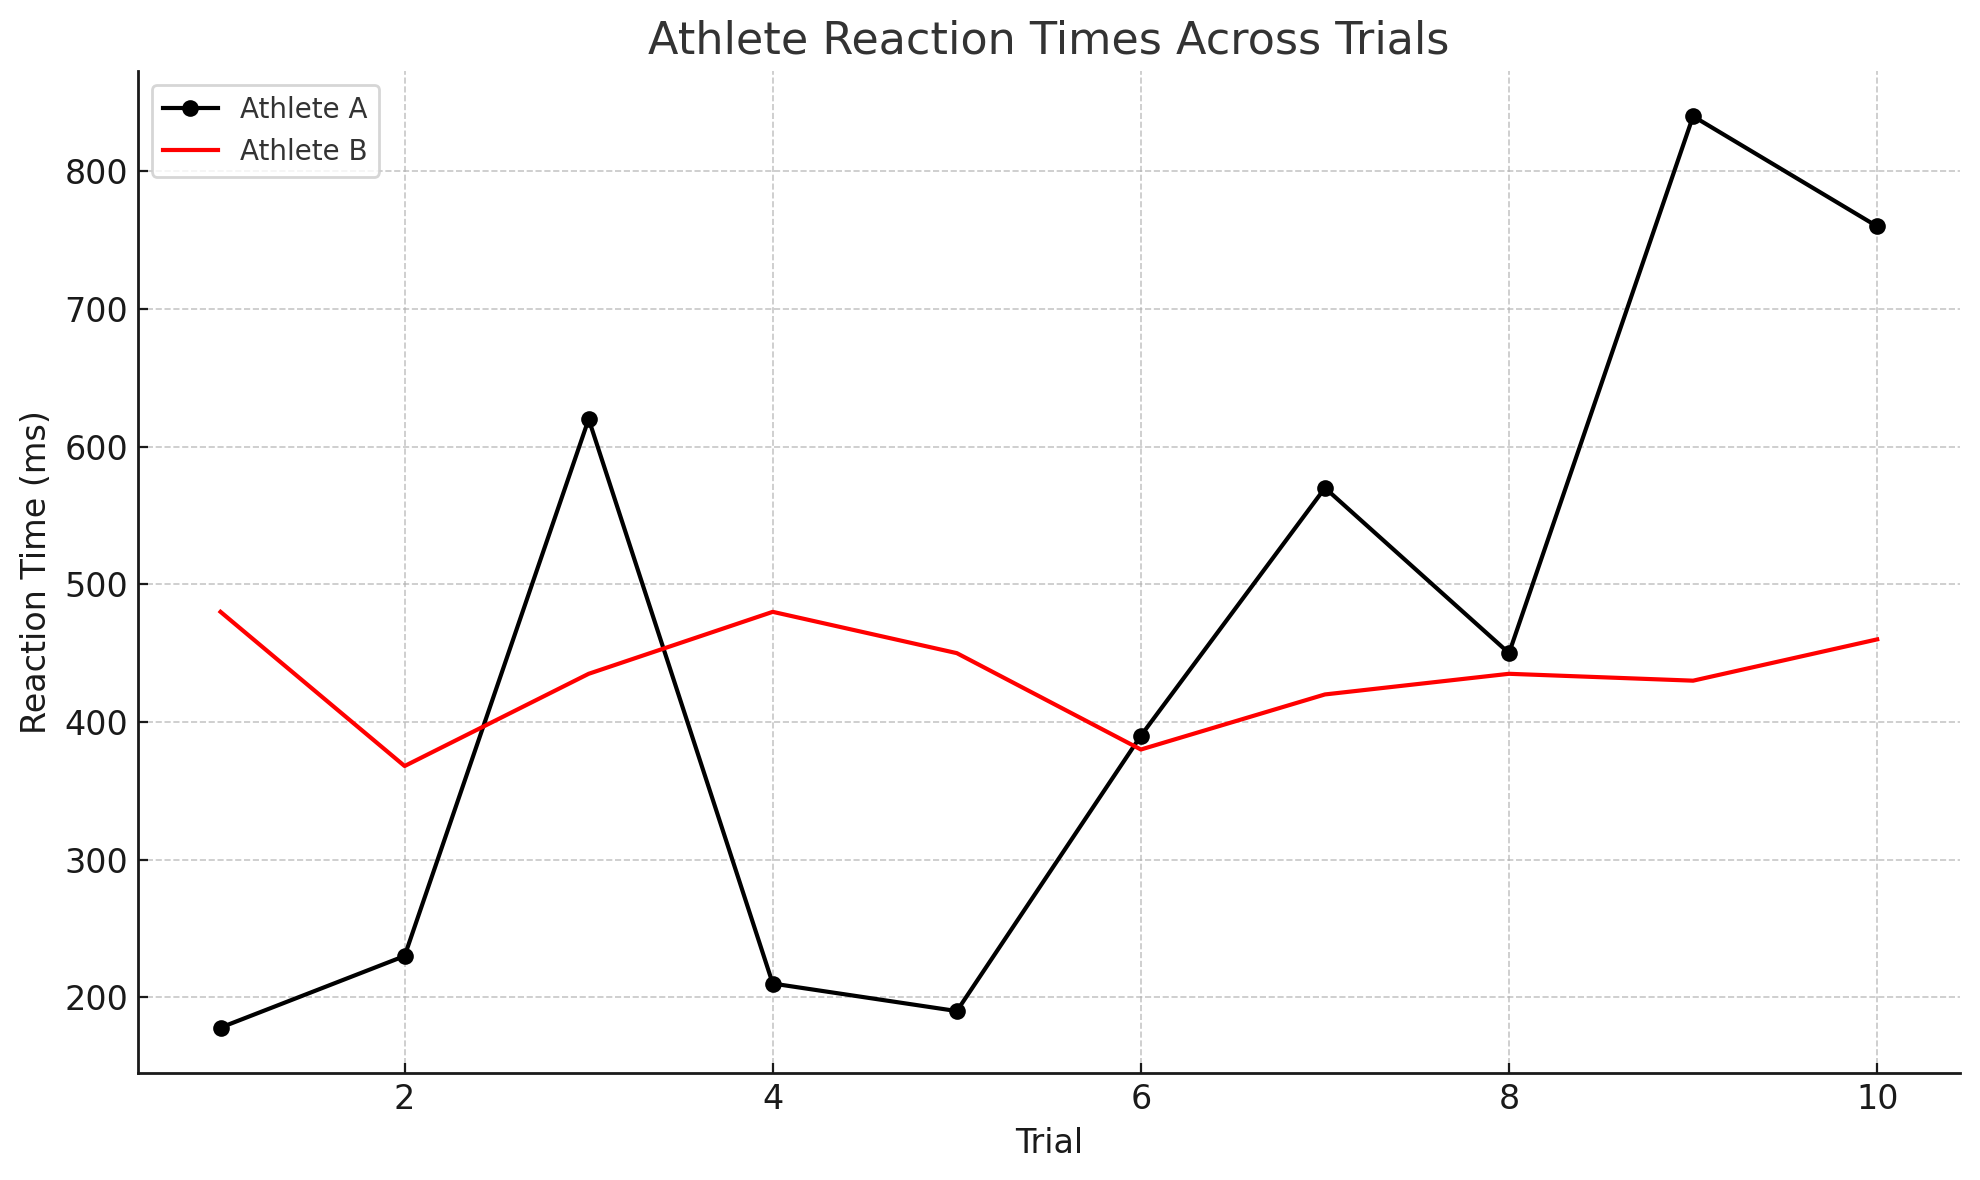
To illustrate, let's examine the reaction times of two hypothetical athletes over a series of trials:
Reaction Times:
Trial | Athlete A | Athlete B |
1 | 178ms | 480ms |
2 | 230ms | 368ms |
3 | 620ms | 435ms |
4 | 210ms | 480ms |
5 | 190ms | 450ms |
6 | 390ms | 380ms |
7 | 570ms | 420ms |
8 | 450ms | 435ms |
9 | 840ms | 430ms |
10 | 760ms | 460ms |
Average | 443.8ms | 433.8ms |
At first glance, Athlete A and Athlete B appear to be closely matched, with their average reaction times differing by merely 10 milliseconds. This superficial assessment might lead one to conclude that their performances are nearly identical. However, this perspective fails to account for the individual trial data, which reveals significant variability in their performances. Such fluctuations can provide deeper insights into an athlete's consistency, resilience, and areas that might benefit from targeted improvement, far beyond what average times can tell us alone.
By focusing solely on averages from a single cognitive performance metric, we risk misinterpreting an athlete's actual performance level and overlook opportunities to refine their training to address these variabilities. It's essential to delve deeper into why understanding these fluctuations is crucial for accurately assessing whether your athlete has truly enhanced their cognitive performance
Uncovering Real Improvement
Genuine improvement is the result of consistent, repeatable enhancements in performance, not merely isolated moments of brilliance. For instance, consider an athlete who displays a significant improvement in reaction time. Without delving into the variability of these improvements, it becomes challenging to discern whether the athlete has truly made progress or if the results are influenced by outliers or particularly favorable conditions.
Imagine analyzing an athlete's data, and you observe that their reaction time has improved from 500ms to 350ms. At first glance, this improvement seems impressive, but a lack of analysis on variability leaves room for doubt regarding the authenticity of this change. When you delve deeper and examine their variability, you discover it has increased from 15% to 35%. This increase suggests that the consistency of their responses has deteriorated, potentially indicating a few exceptionally quick responses that might have been flukes, skewing the average downwards. So, has the athlete genuinely improved? Not necessarily; they've become quicker but more unpredictable in their performance.
Conversely, if an athlete improves from 500ms to 350ms while maintaining the same level of variability, it implies they are achieving faster responses with the same consistency. However, the epitome of improvement is seen when they not only reduce their reaction time but also enhance their consistency, indicating increased neural efficiency. This example underscores the importance of evaluating more than one performance metric to avoid misconceptions about an athlete's progress based solely on improvements in reaction time.
Navigating the Nuances of Cognitive Performance
The critical examination of variability in cognitive performance metrics is fundamental to truly understanding an athlete's capabilities. Throughout this exploration, we've seen how relying solely on averages might lead us astray, painting an incomplete picture of an athlete’s progress and potential. By adopting a nuanced approach that accounts for the variability in these metrics, coaches, trainers, and athletes themselves can unlock deeper insights into cognitive fluctuations, paving the way for more personalized and effective training strategies.
Genuine improvement in cognitive performance—evidenced by consistent, repeatable enhancements—demands a comprehensive evaluation beyond mere a reduction in reaction times. Our discussion highlights the pitfalls of superficial improvements, stressing the importance of evaluating both the average performance and its variability.
As we conclude, the call to action is to lean into this complexity. Embrace the full spectrum of cognitive performance analysis by considering variability as a key indicator of true improvement. This approach will not only provide a more accurate assessment of an athlete's development but also guide the optimization of training methods to achieve peak cognitive performance.
🌐 Connect With Us
🌍 Soma Technologies: Engineered to enhance human performance.
📸 Instagram: Dive into our world through exclusive photos and stories.
👥 Facebook: Join our community for the latest updates and discussions.
📈 LinkedIn: Connect with us professionally and stay informed about industry news.
🎥 YouTube: Watch our latest videos, tutorials.
🐦 X: Follow us for instant updates, news, and engaging tweets.