
Others Show You the Tip, We Reveal the Depths
Understanding cognitive performance requires a deeper dive into a range of metrics that offer a fuller picture of an athlete’s cognitive abilities.

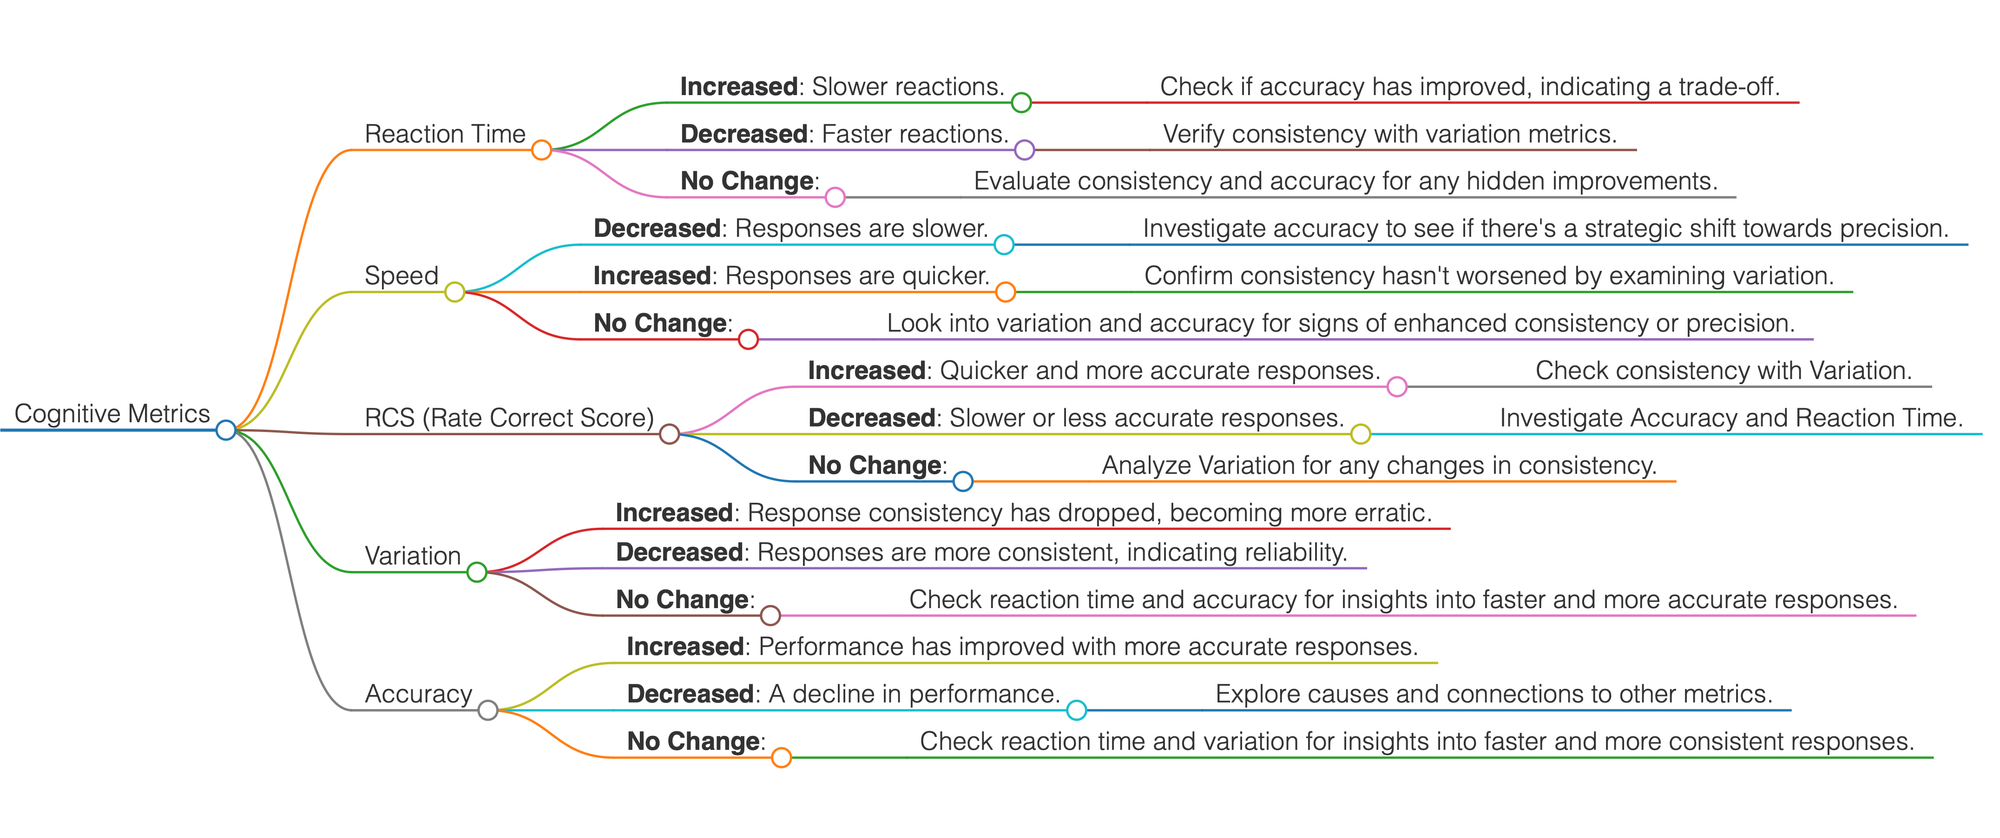
When it comes to cognitive training, reaction time and accuracy are just the tip of the iceberg. They offer a glimpse into how quickly and precisely an athlete can respond, but they don't tell the whole story. You might think that a faster reaction time means better cognitive performance, but it's not that simple. Understanding cognitive performance requires a deeper dive into a range of metrics that offer a fuller picture of an athlete’s cognitive abilities and progress.
Let’s start with the basics. Reaction time is the most familiar metric in cognitive training. It measures how fast your athlete responds to a stimulus during a task. While it's tempting to assume that a lower reaction time is always better, this metric alone is insufficient. Reaction time can be highly variable, influenced by numerous factors such as the athlete’s mental state, physical condition, and even external distractions, making it unreliable as a standalone measure of improvement.
To get a clearer picture, we need to consider the consistency of an athlete's performance. This is where the Coefficient of Variation (CV) comes into play. CV is a critical metric that assesses the reliability of an athlete's reaction time by comparing the standard deviation to the average reaction time. Let’s delve into an example to illustrate this concept more clearly.
Take, for instance, two athletes with the same average reaction time of 250 milliseconds. Athlete A has a standard deviation of 20 milliseconds, resulting in a CV of 8%. This low CV indicates that Athlete A's reaction times are consistently close to the average, showing steady performance. On the other hand, Athlete B has a standard deviation of 70 milliseconds, leading to a CV of 28%. This high CV reveals significant variability in Athlete B's performance, indicating less consistency. Even with identical average reaction times, Athlete A’s performance is more reliable, while Athlete B’s performance fluctuates. This consistency is crucial for confirming genuine improvement in reaction time.
Once you've verified improvement in reaction time and consistency, the next step is to look at speed. Speed normalizes reaction time by accounting for outliers and variances, providing a clearer picture of an athlete's true performance level. This normalization is essential for making fair comparisons among athletes and accurately tracking individual progress over time. If an athlete's speed improves significantly more than their reaction time, or if it deteriorates, it might indicate outliers—extreme responses that skew the average. This is why cross-checking reaction time with variation and speed is necessary to ensure accurate assessment.
After addressing reaction time, variation, and speed, the next focus is accuracy. Accuracy measures how often an athlete responds correctly during a task. It's straightforward: higher accuracy is always better. This metric helps you understand if the athlete is improving in their decision-making capabilities and maintaining precision under varying conditions. An athlete might be fast, but if they are not accurate, their cognitive performance is still lacking. Therefore, tracking accuracy along with reaction time provides a more complete view of cognitive performance.
The final metric to consider is Rate Correct Score (RCS). RCS quantifies the number of correct responses per second of neural activity. A higher RCS indicates that the athlete is not only fast but also accurate. This metric can be aggregated over a session to evaluate the total cognitive load an athlete can handle. For instance, if an athlete completes three 10-minute tasks and achieves an average of 2.5 correct responses per second, the total would be 4,500 correct responses per session. This provides a comprehensive view of their cognitive workload.
At Soma, we believe in going beyond basic metrics. Our platform offers minute-by-minute insights, providing granular data that is invaluable for identifying breaking points and understanding an athlete's limits. This real-time monitoring capability is a game-changer for coaches and athletes alike, offering a dynamic and detailed perspective on cognitive performance that static, end-of-session summaries simply can’t match.
By monitoring reaction time throughout a task, coaches can see how athletes adapt to cognitive loads. If reaction time consistently decreases, it may indicate that the load is too light. Conversely, if reaction time increases, it could signal fatigue or a deliberate slowdown for greater accuracy. Minute-by-minute data provides a deeper understanding than just the average reaction time at the end of the task. For example, an athlete might start strong but fade as the task progresses, indicating potential issues with stamina or focus that need to be addressed.
Analyzing variation over time offers another layer of insight. An increase in variation usually points to fatigue, while fluctuating variation suggests that the athlete is being challenged and hasn't yet adapted to the stimulus. Low variation could indicate that the task is too easy or that maintaining neural efficiency during the season is the goal. This kind of analysis helps in tailoring training sessions to push athletes just enough without overwhelming them, striking a perfect balance between challenge and achievability.
Tracking accuracy minute-by-minute helps identify decision fatigue. If accuracy declines, it may indicate that the athlete is sacrificing precision for speed. On the other hand, improving accuracy could mean they are slowing down to make better decisions. Cross-referencing accuracy with reaction time provides a comprehensive view of their performance. For instance, if an athlete’s reaction time increases but their accuracy also improves, it suggests they are taking a bit more time to ensure correct responses—a strategic adjustment rather than a sign of declining performance.
Soma also integrates physiological metrics such as BPM (Beats Per Minute) and HRV (Heart Rate Variability). By observing these metrics during cognitive tasks, coaches can gauge cognitive stress and adjust training loads accordingly. An increase in heart rate or a decrease in HRV might indicate that the cognitive load is challenging, while stable metrics could suggest that the load is manageable. Monitoring these physiological responses in real-time alongside cognitive metrics offers a holistic view of an athlete’s condition, allowing for more precise adjustments and better overall training outcomes.
Consider an athlete undergoing a cognitive training session where both their cognitive and physiological metrics are being monitored. If their reaction time starts to increase while their heart rate also spikes, it might be a clear indicator of cognitive overload or physical fatigue. On the other hand, if their HRV remains stable and their accuracy improves, it suggests that they are efficiently managing the cognitive load and performing well under pressure.
This multi-faceted approach to monitoring and analyzing performance is what sets Soma apart. Our platform doesn’t just stop at providing data; it interprets it, offering actionable insights that help coaches and athletes make informed decisions. The ability to tailor training programs based on minute-by-minute data ensures that athletes are always training at their optimal level, avoiding both undertraining and overtraining.
Furthermore, Soma's detailed insights allow for the identification of specific areas where an athlete might be struggling. For example, if minute-by-minute analysis shows that an athlete’s performance drops significantly during a particular phase of a task, coaches can focus on that specific segment, developing targeted exercises to improve performance in that area.
In addition to these practical applications, the data provided by Soma can also be used for long-term performance tracking. Over weeks and months, trends and patterns in an athlete’s data can reveal deeper insights into their cognitive development and highlight areas for continuous improvement. This long-term perspective is invaluable for setting realistic goals and measuring progress over time.
At Soma, our commitment to providing detailed, actionable data extends to every aspect of our platform. From the initial setup and baseline testing to ongoing performance monitoring and post-session analysis, we ensure that every piece of information is accurate and useful. Our user-friendly interface makes it easy for coaches and athletes to access and interpret their data, fostering a culture of continuous improvement and informed decision-making.
With Soma, you get more than just basic cognitive metrics. Our platform provides detailed, minute-by-minute insights into both cognitive and physiological performance, ensuring that no detail is overlooked. This comprehensive approach allows coaches to tailor training programs to each athlete's unique needs, optimizing their cognitive development and performance. The integration of cognitive and physiological data creates a rich, multi-dimensional view of each athlete, enabling more effective and personalized coaching strategies.
Others Show You the Tip, We Reveal the Depths
🌐 Connect With Us
🌍 Soma Technologies: Engineered to enhance human performance.
📸 Instagram: Dive into our world through exclusive photos and stories.
👥 Facebook: Join our community for the latest updates and discussions.
📈 LinkedIn: Connect with us professionally and stay informed about industry news.
🎥 YouTube: Watch our latest videos, tutorials.
🐦 X: Follow us for instant updates, news, and engaging tweets.